BRIEF · FINANCIAL INFRASTRUCTURE
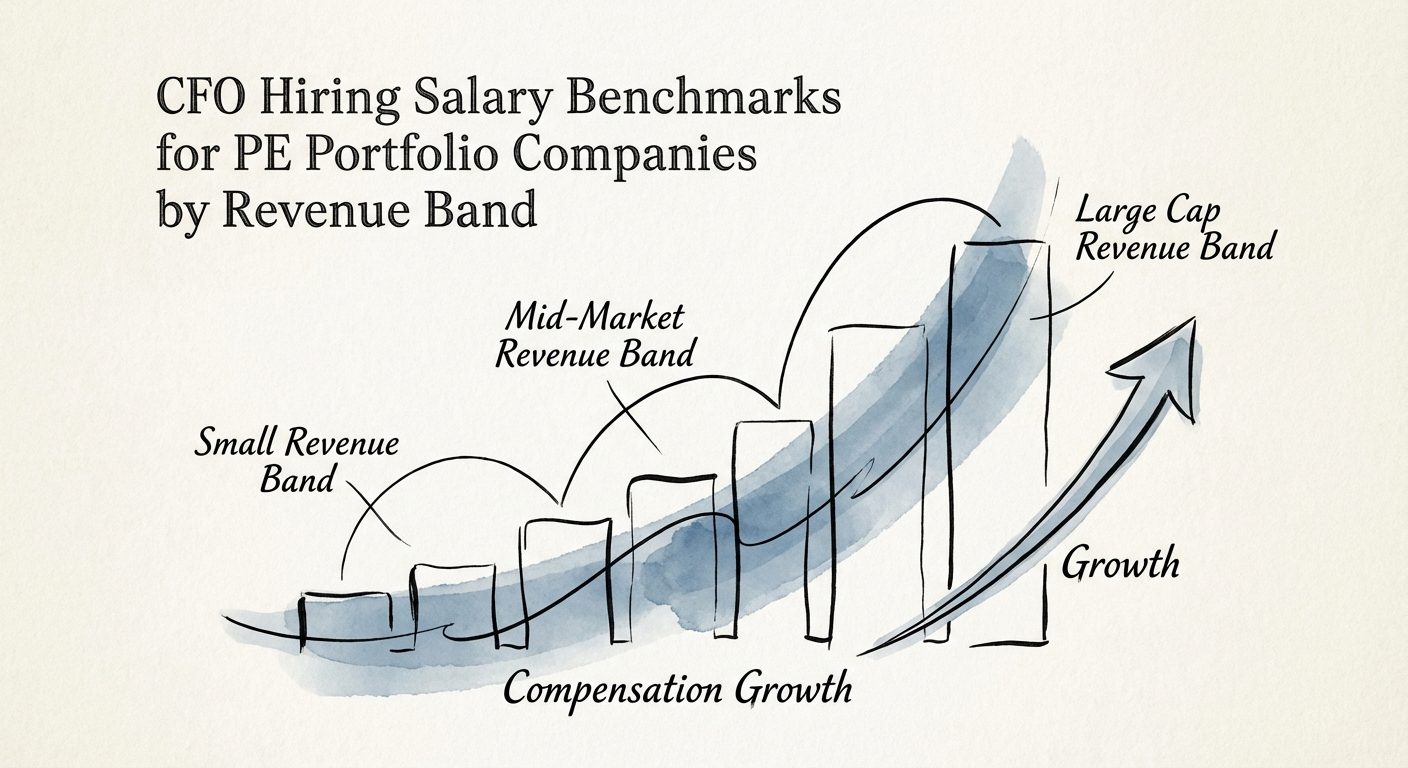
What a PE Portfolio CFO Actually Costs in 2026, by Revenue Band
Base, bonus, and equity for PE-backed CFOs at $10-50M, $50-100M, and $100-250M revenue — plus how to structure the grant so the hire stays through exit.
$472k - $550k Avg. Total Cash Comp ($100M-$250M Rev)

BRIEF · FINANCIAL INFRASTRUCTURE
12 KPIs PE Operating Partners Track Weekly in Portfolio Companies
Stop waiting for monthly board decks. The top 12 KPIs elite PE Operating Partners track weekly to predict EBITDA, from Forecast Accuracy to 13-Week Cash Variance.
68.9% Median Billable Utilization
BRIEF · GTM EXECUTION
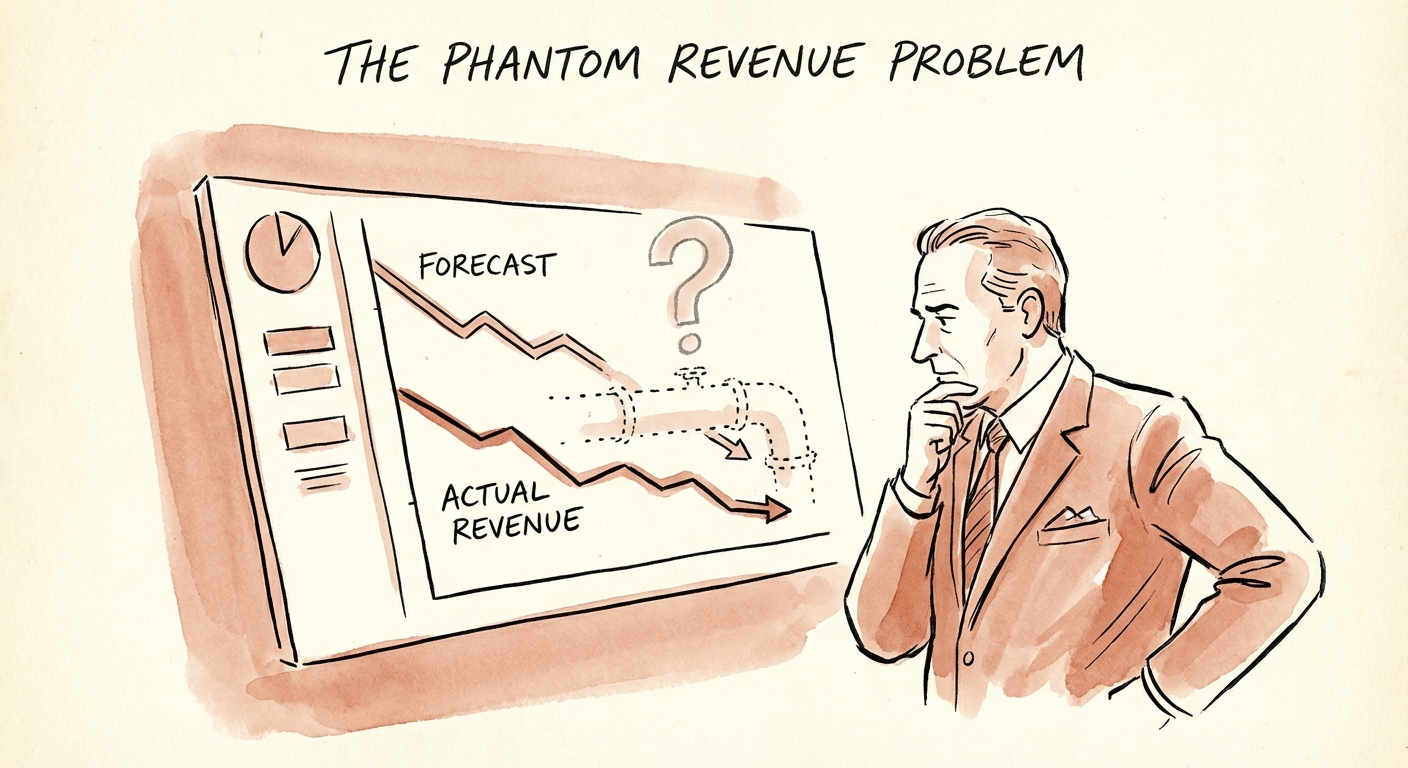
Phantom Revenue: Why Your $7.5M Pipeline Quietly Misses Quota
Your CRM shows 5x coverage and you still miss. Here is how to spot stalled deals, set kill criteria, and clean a founder-CEO's forecast — without firing anyone.
60% Deals Lost to 'No Decision'
BRIEF · GTM EXECUTION
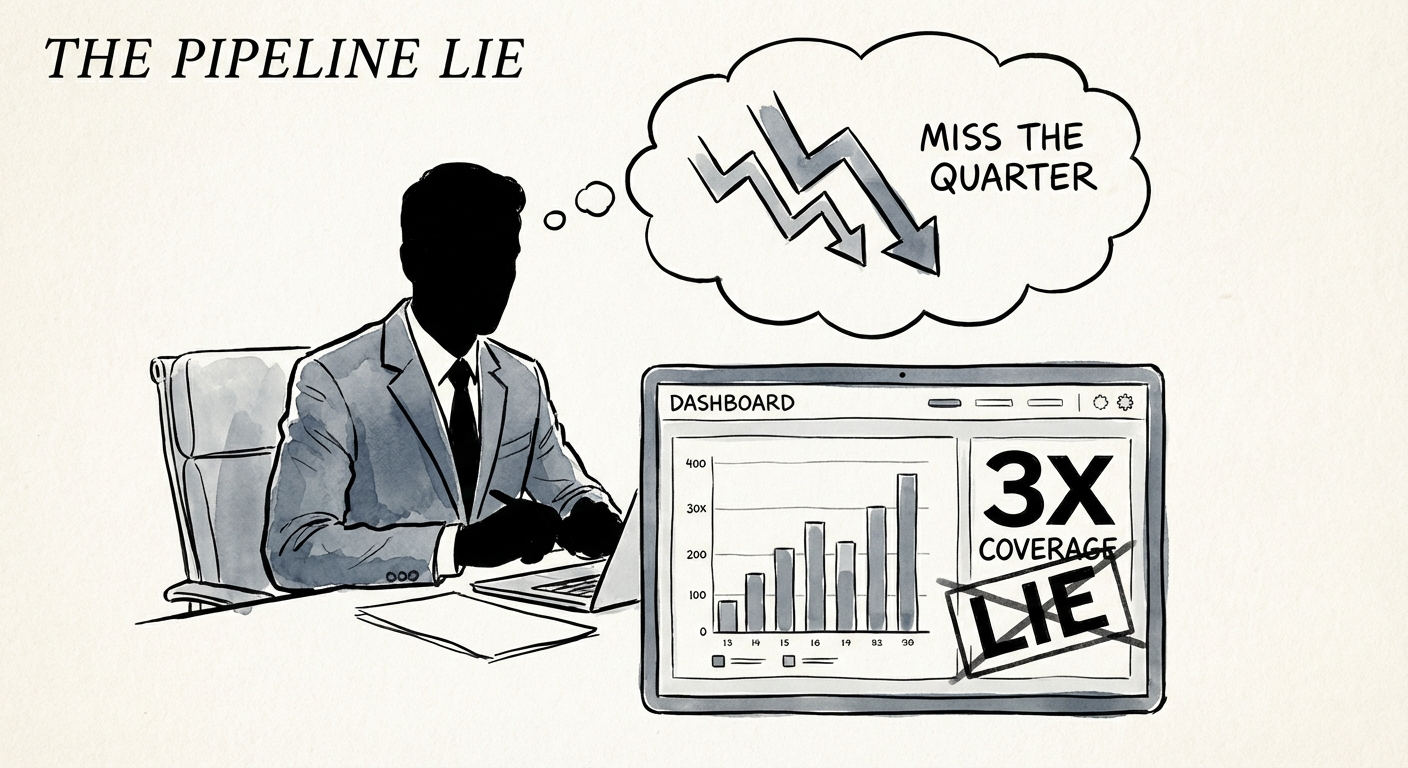
3.2x Coverage, Still Missing: The Forecast Math Founders Keep Getting Wrong
Your VP says 3.2x coverage. At a 19% win rate, that books only about $608K of a $1M quota -- a 39% miss. Here is the forecast math "healthy" pipeline hides.
19% Avg. B2B Win Rate (2025)
BRIEF · GTM EXECUTION
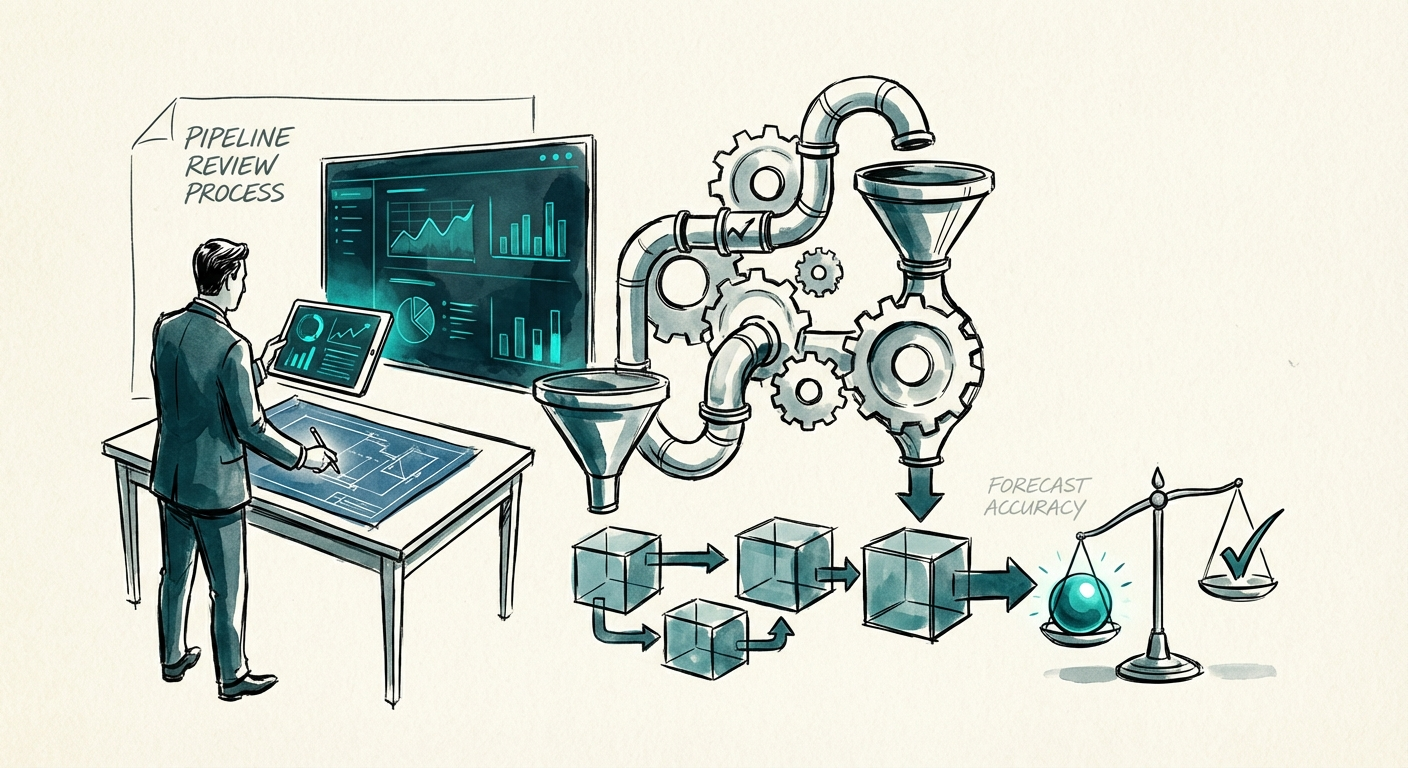
How to Build a Pipeline Review Process That Improves Forecast Accuracy
Stop missing the quarter. Learn the forensic pipeline review process that drives 28% higher quota attainment and 95% forecast accuracy.
28% Higher Quota Attainment
BRIEF · MIGRATION & INTEGRATION
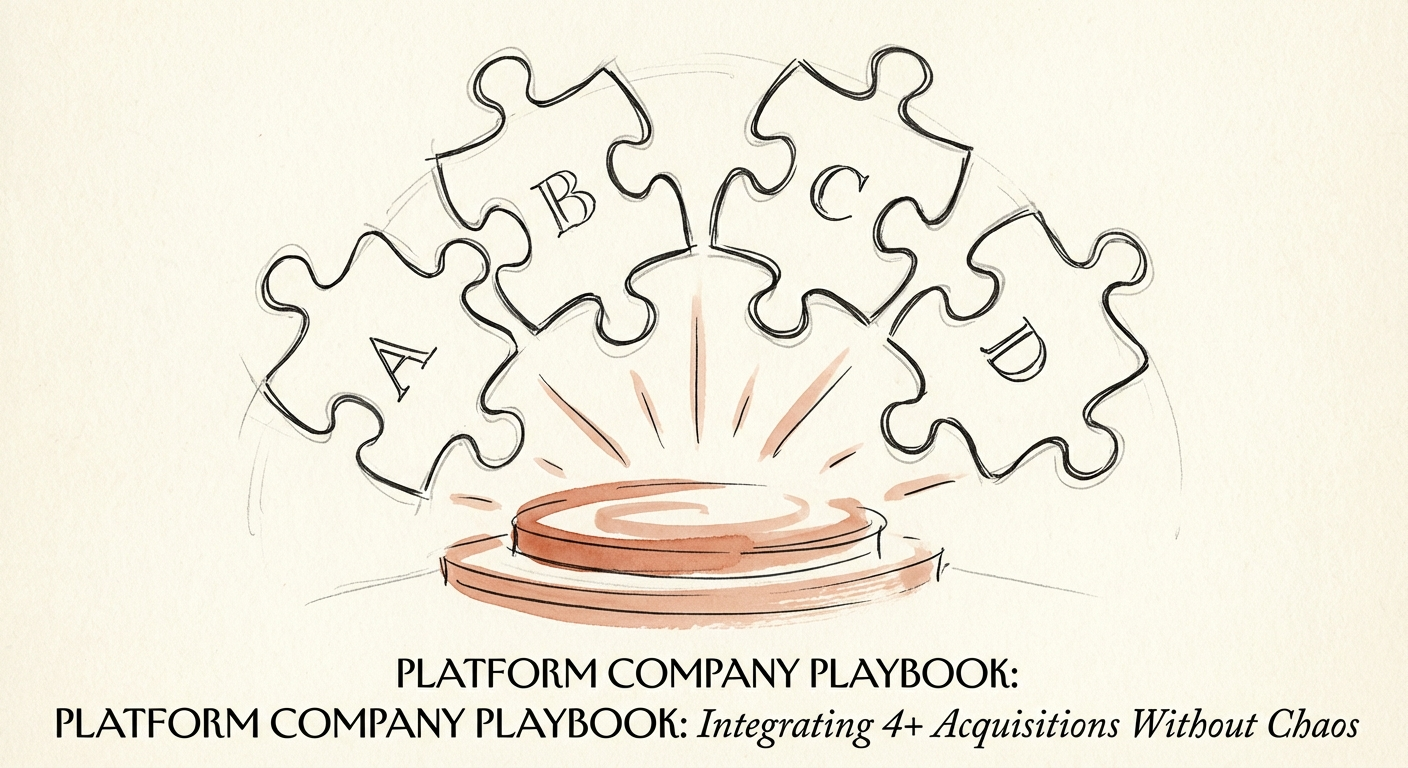
The Platform Company Playbook: Integrating 4+ Acquisitions Without Chaos
Stop running a federation of companies. Learn the Platform Company Playbook to integrate 4+ acquisitions, capture 30-50% more value, and secure your multiple.
30-50% Value Lost to Slow Integration
BRIEF · MIGRATION & INTEGRATION
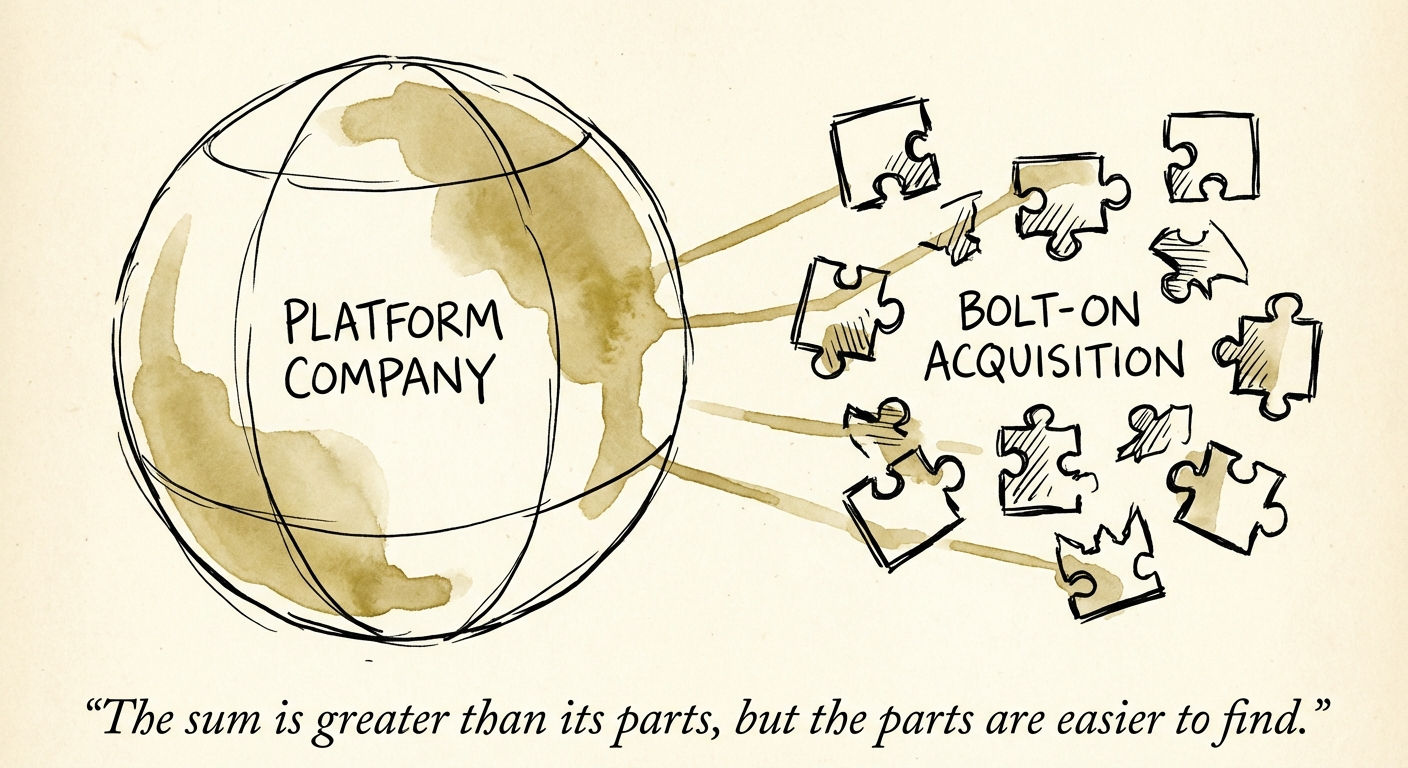
Platform Company vs. Bolt-On: Why Your 'Buy-and-Build' Is Creating a Fragmented Portfolio
75% of PE activity is now add-on acquisitions, yet 70% fail to capture synergies. Learn how to convert a loose collection of bolt-ons into a platform commanding an 8.2x valuation multiple.
8.2x Platform Revenue Multiple
BRIEF · FINANCIAL INFRASTRUCTURE
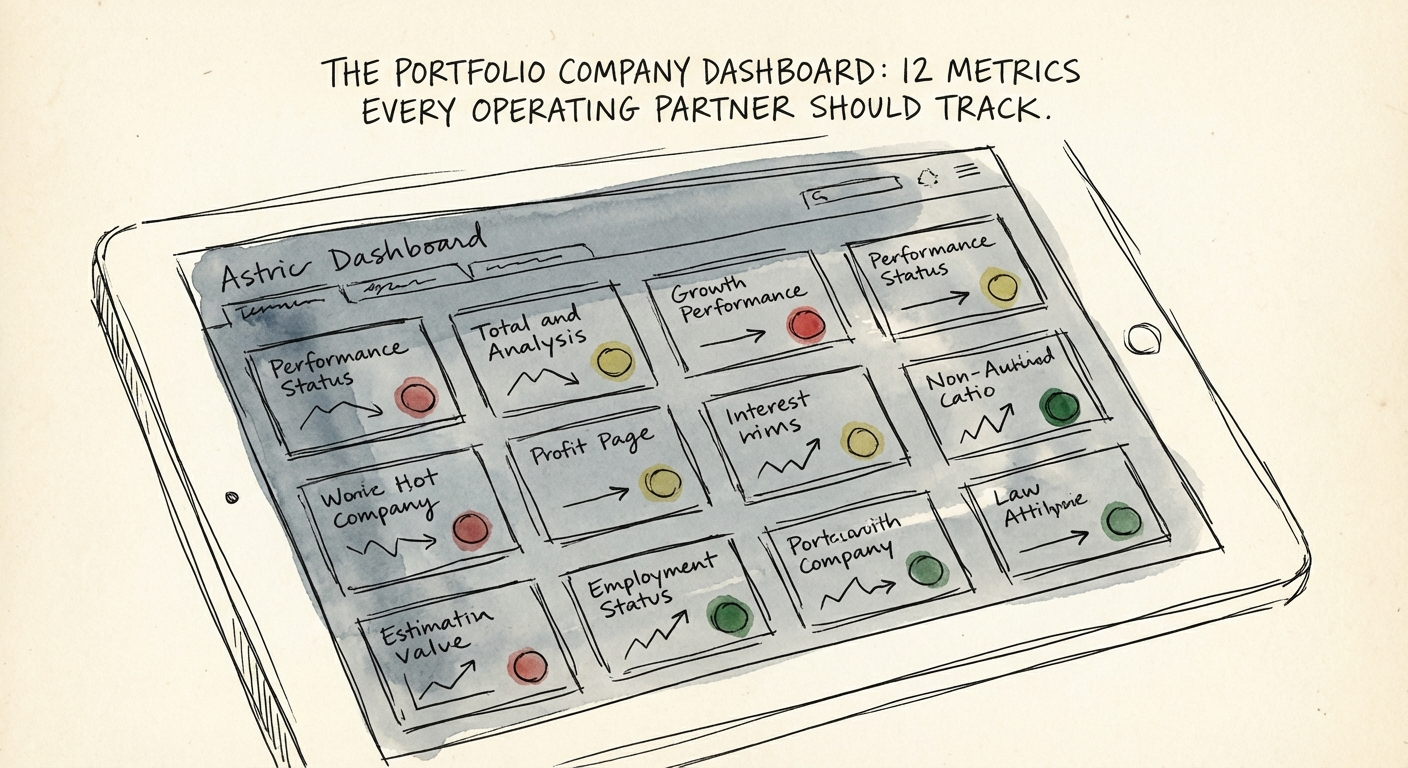
The Portfolio Company Dashboard: 12 Metrics Every Operating Partner Should Track
Stop relying on lagging board decks. Here are the 12 critical KPIs for PE Operating Partners in 2025, backed by KeyBanc and SPI Research benchmarks.
9.8% Median Services EBITDA (2025)
BRIEF · MIGRATION & INTEGRATION
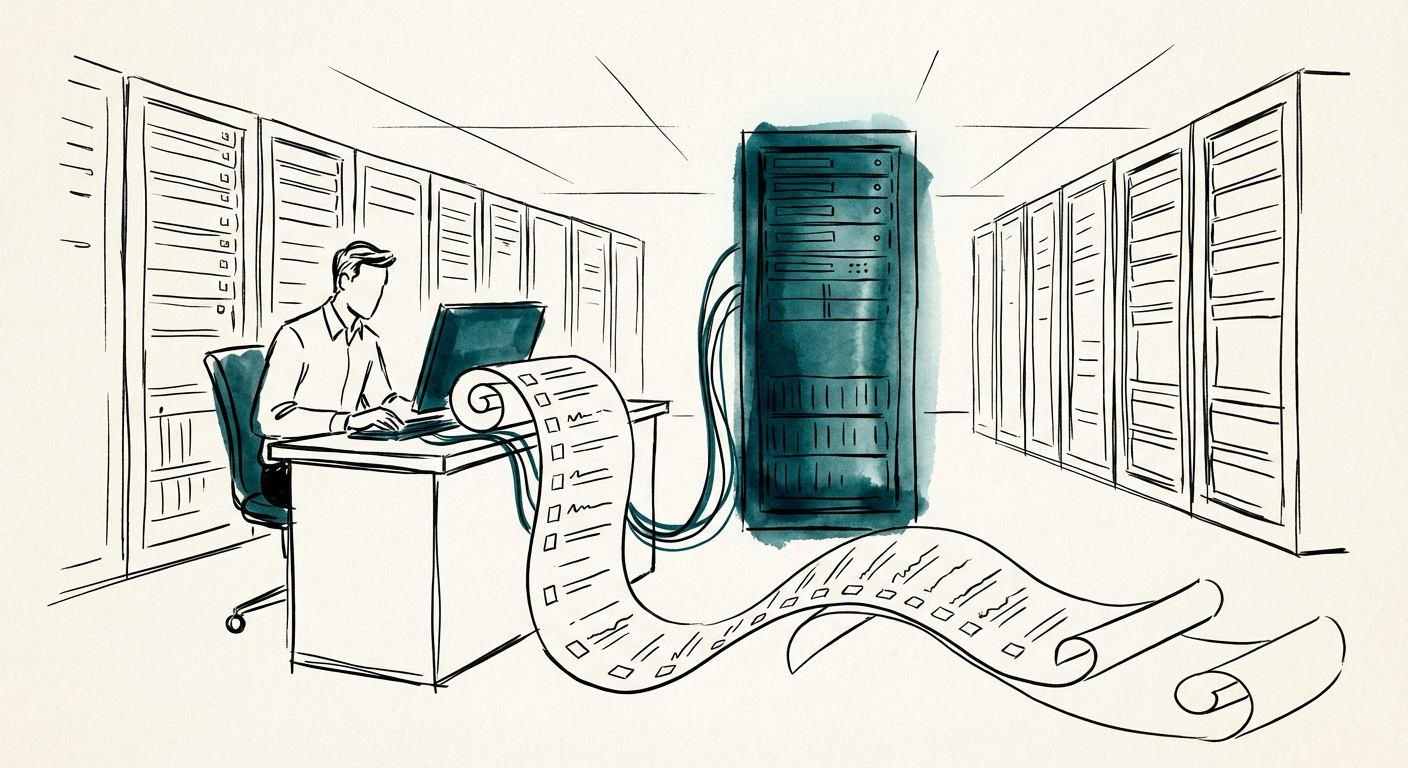
Post-Acquisition Day 1 IT Checklist: 47 Tasks That Can't Wait
53% of buyers discover unknown cyber risks post-close. Download the operator's Day 1 IT checklist to lock down identity, assets, and data immediately.
53% of buyers find unknown cyber risks post-close
BRIEF · TEAM & HIRING
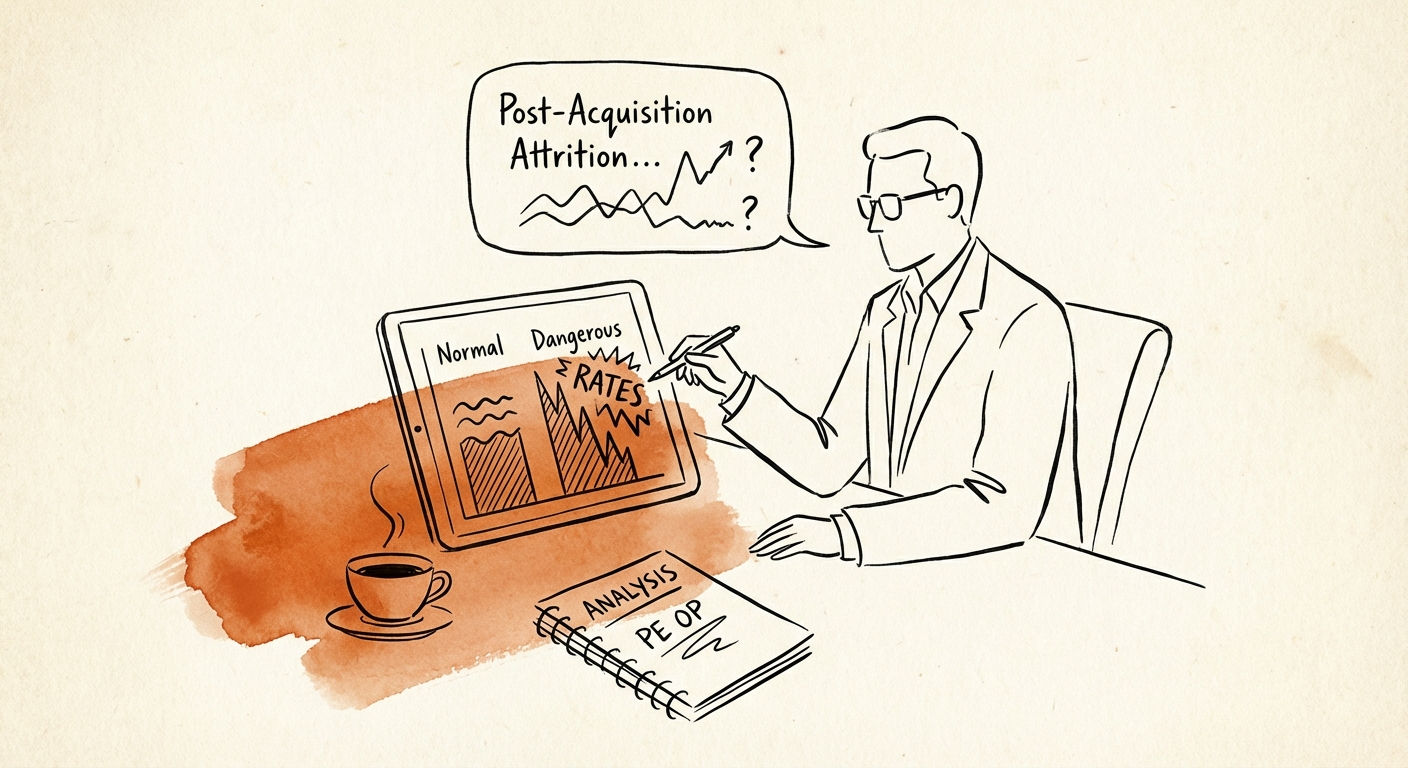
Post-Acquisition Attrition: The 33% Cliff That Kills Deal Value
Post-acquisition attrition benchmarks for PE operators: what turnover is normal, what becomes dangerous, and which roles put deal value at risk.
33% Year 1 Attrition Rate
BRIEF · TEAM & HIRING
Why Add-On Acquisitions Stall: The Approval-Chain Clash PE Models Ignore
A founder-led target moves in 2 days; your platform takes 2 weeks. That gap, not "values," is what kills synergies. How operating partners measure and bridge it.
70% Synergy Failure Rate
BRIEF · MIGRATION & INTEGRATION
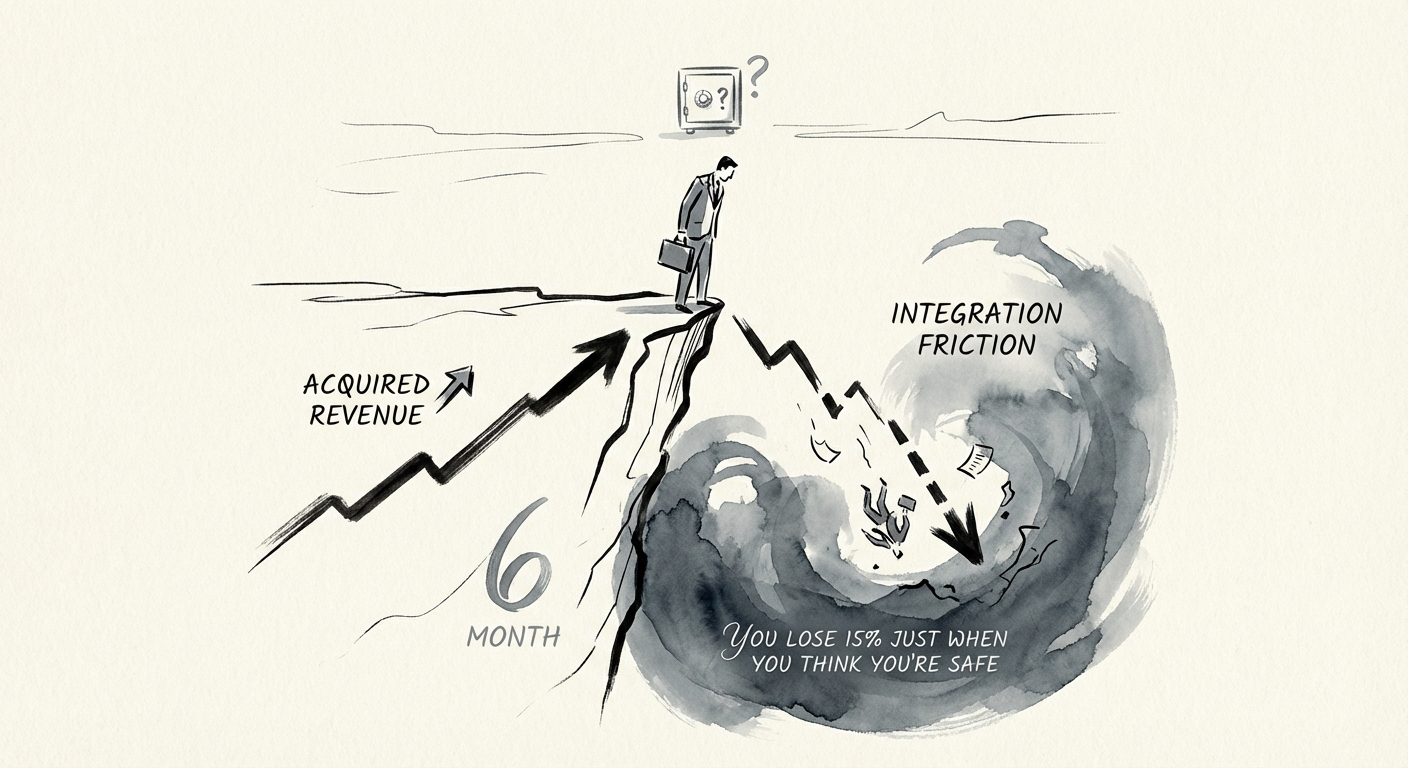
The 'Month 6 Cliff': Why You Lose 15% of Acquired Revenue Just When You Think You're Safe
Post-merger churn often spikes in Month 6, not Month 1. Discover why the 'Integration Reality Check' costs PE firms 17% of acquired revenue and how to stop it.
17% Avg. Client Loss Post-Merger
BRIEF · MIGRATION & INTEGRATION
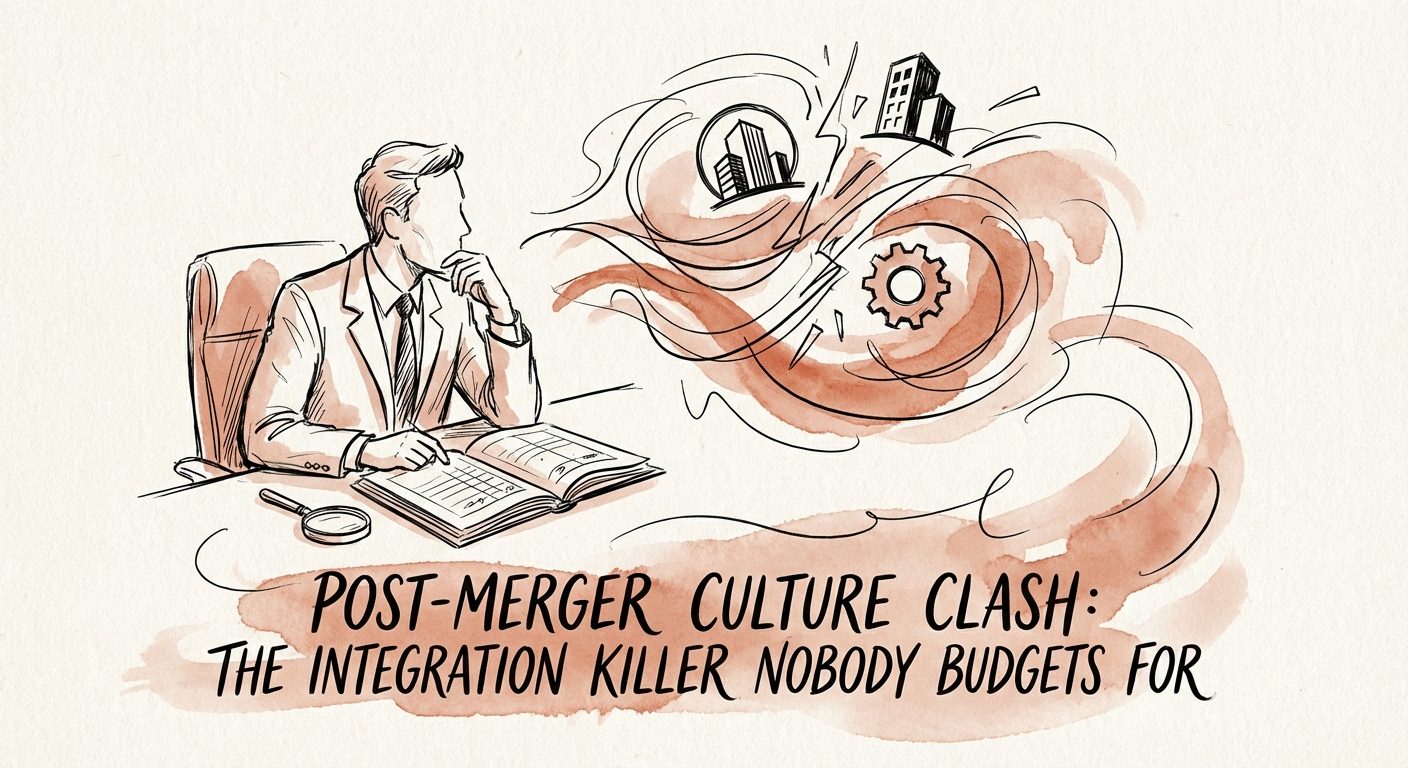
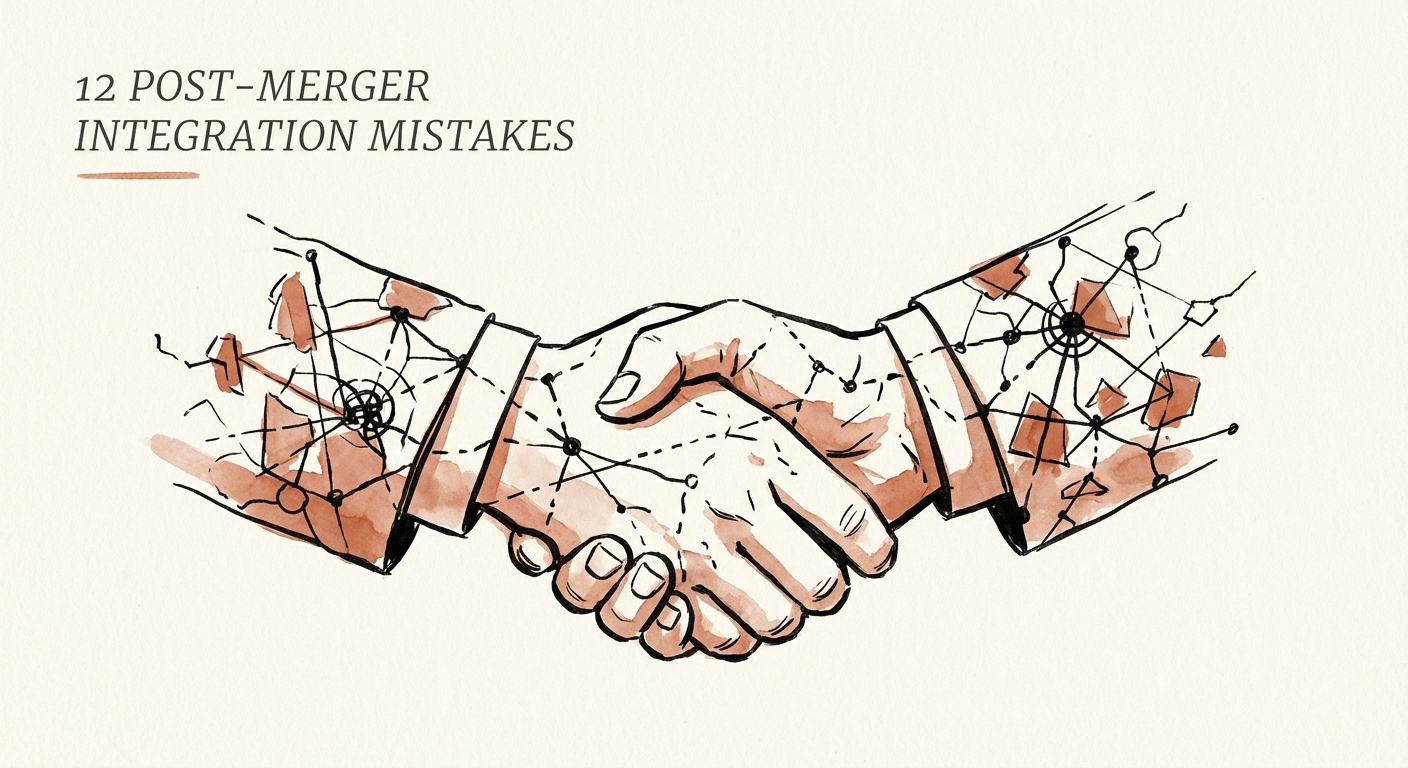
Post-Merger Integration in Tech: 12 Day-1-to-100 Mistakes That Quietly Eat the Deal
70-90% of M&A deals miss their model. In tech deals the value leaks in the first 100 days — through code, CRMs, and the frozen middle. Here's where, and the fix.
70-90% M&A Failure Rate
BRIEF · PROJECT RECOVERY
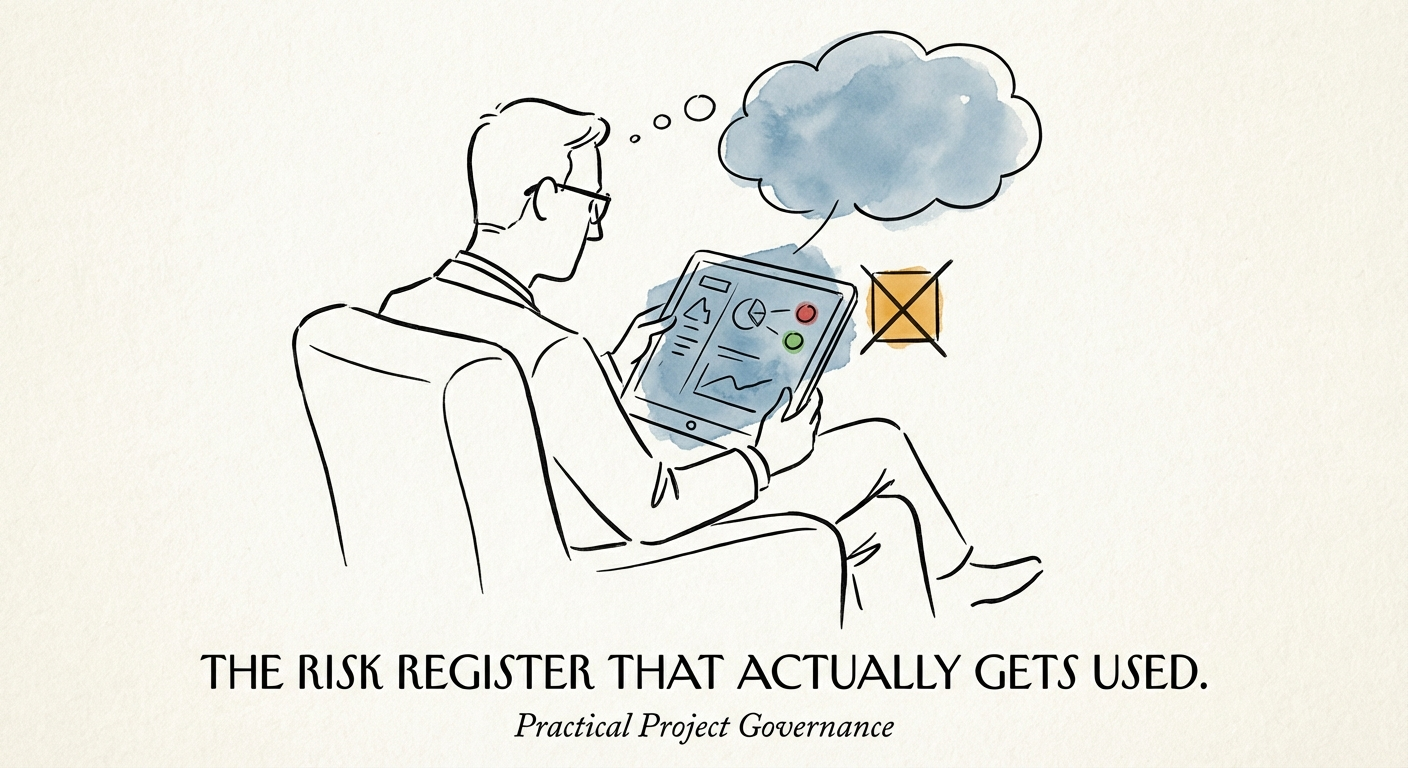
Your $50M Transformation's Risk Register Is Lying to You
Most enterprise risk registers are amber-colored theater. Here is how a CIO turns a stale spreadsheet into a weekly early-warning system that catches the real threats.
37% Projects Miss Targets due to Poor Risk Mgmt
BRIEF · REVENUE ARCHITECTURE
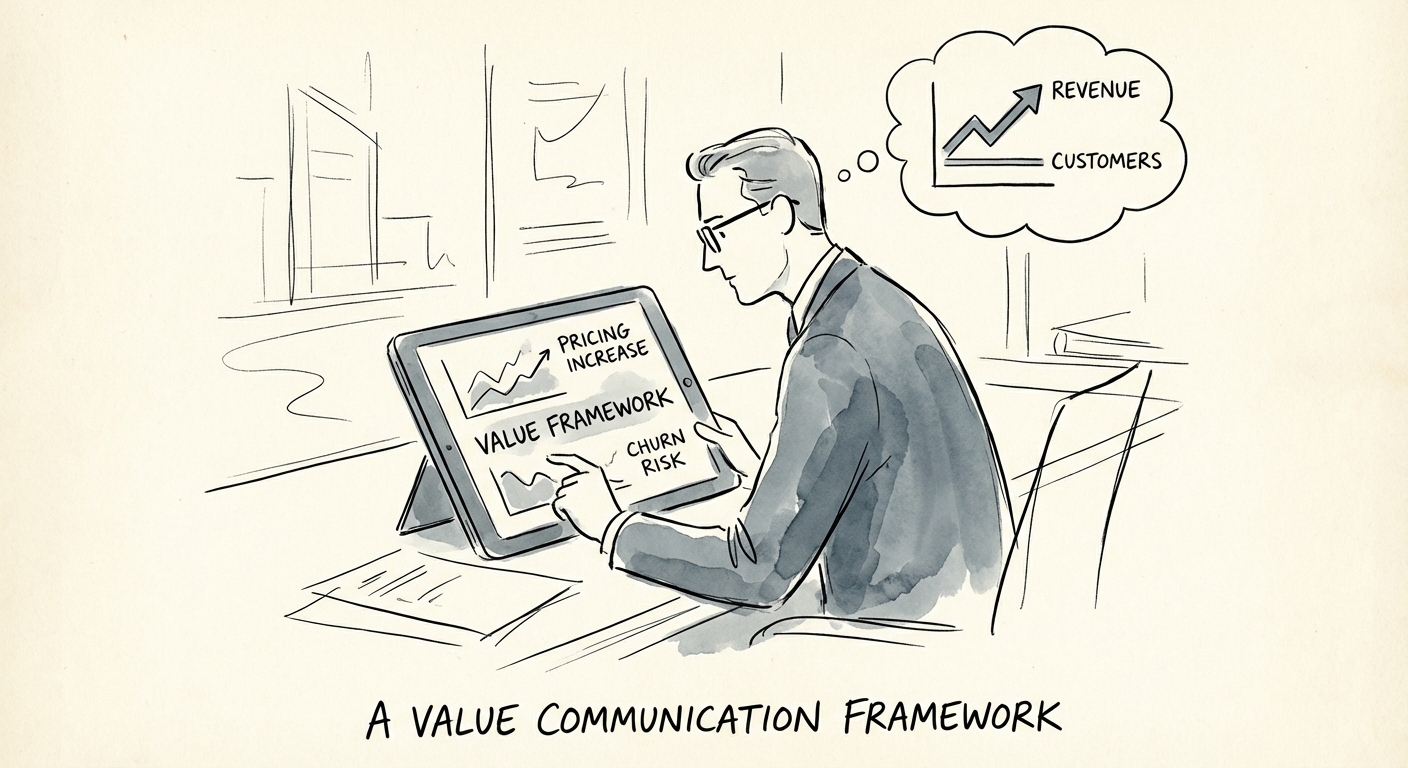
How to Raise Prices on Grandfathered Customers Without Triggering Churn
Grandfathered accounts paying 2019 rates quietly cap your valuation. Here's the cohort-by-cohort framework for raising prices in 2025 without losing the customers worth keeping.
12.7% Profit Lift from 1% Price Hike
BRIEF · PROCESS DOCUMENTATION
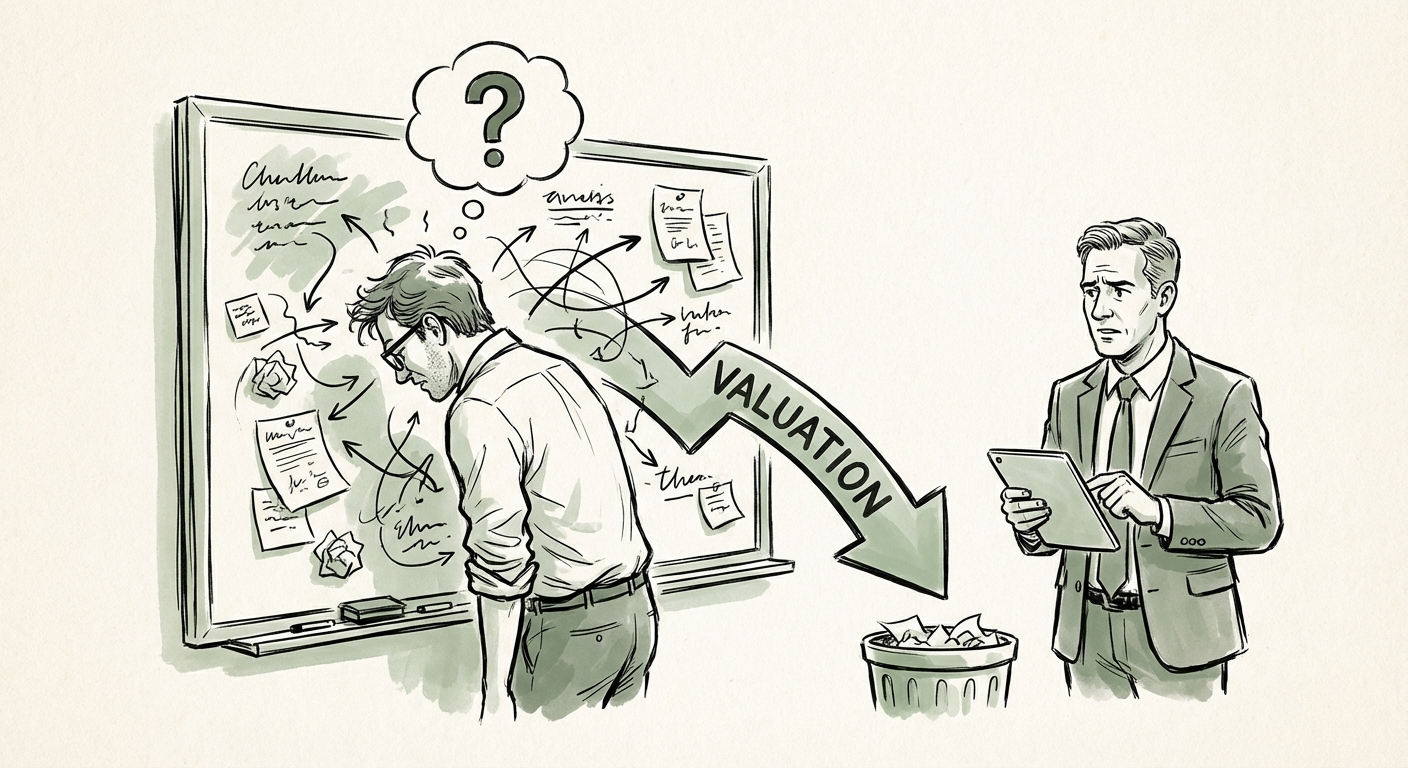
The Diligence Room Question That Costs Founders Millions: "Who Knows This Besides You?"
A buyer's analyst can erase 15-25% of your valuation in one afternoon of diligence. Here are the documentation failures they hunt for in founder-led tech firms.
25% Valuation Haircut
BRIEF · EXIT READINESS
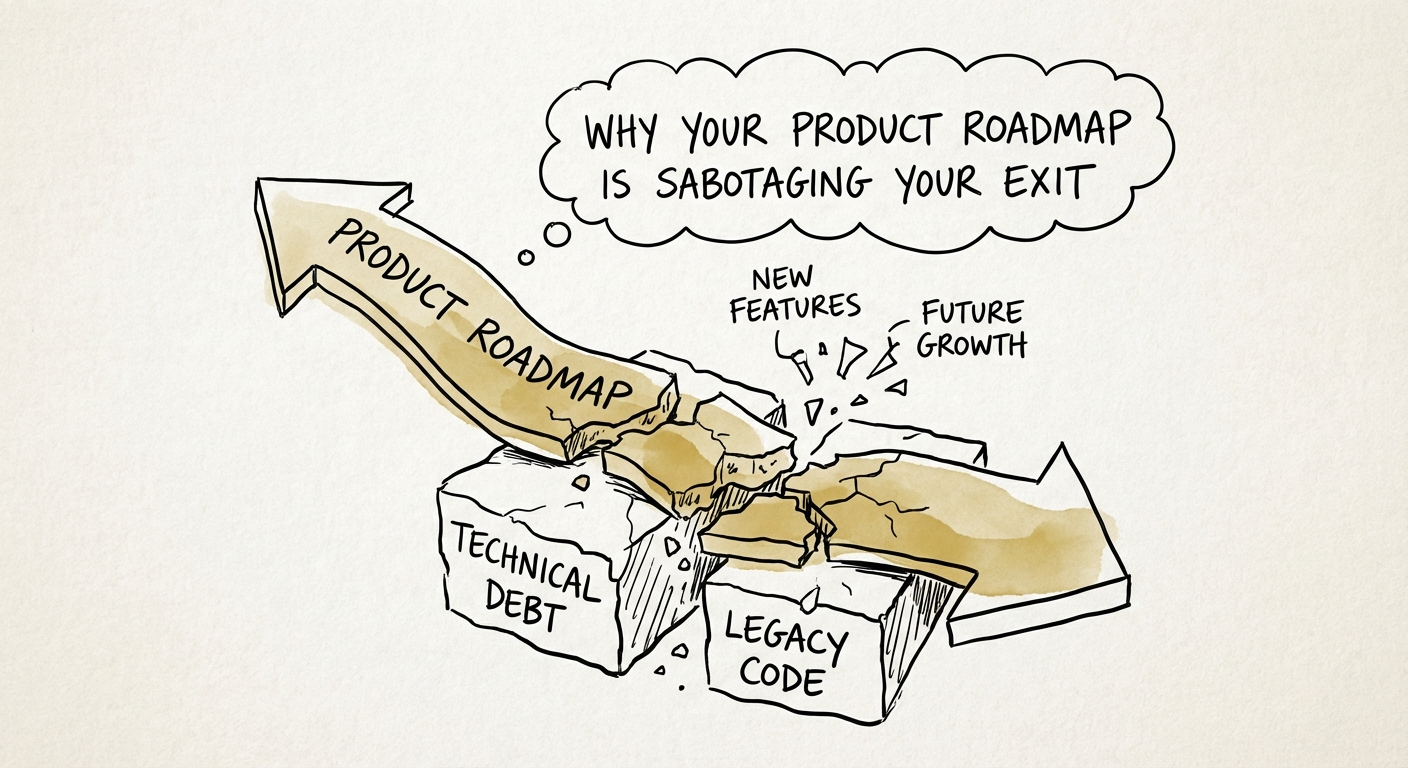
Why Your Product Roadmap Is Sabotaging Your Exit
Technical debt consumes 40% of IT budgets and kills exit multiples. Learn why your roadmap is a financial liability and how to fix it before due diligence.
40% IT Budget Consumed by Tech Debt
BRIEF · EXIT READINESS
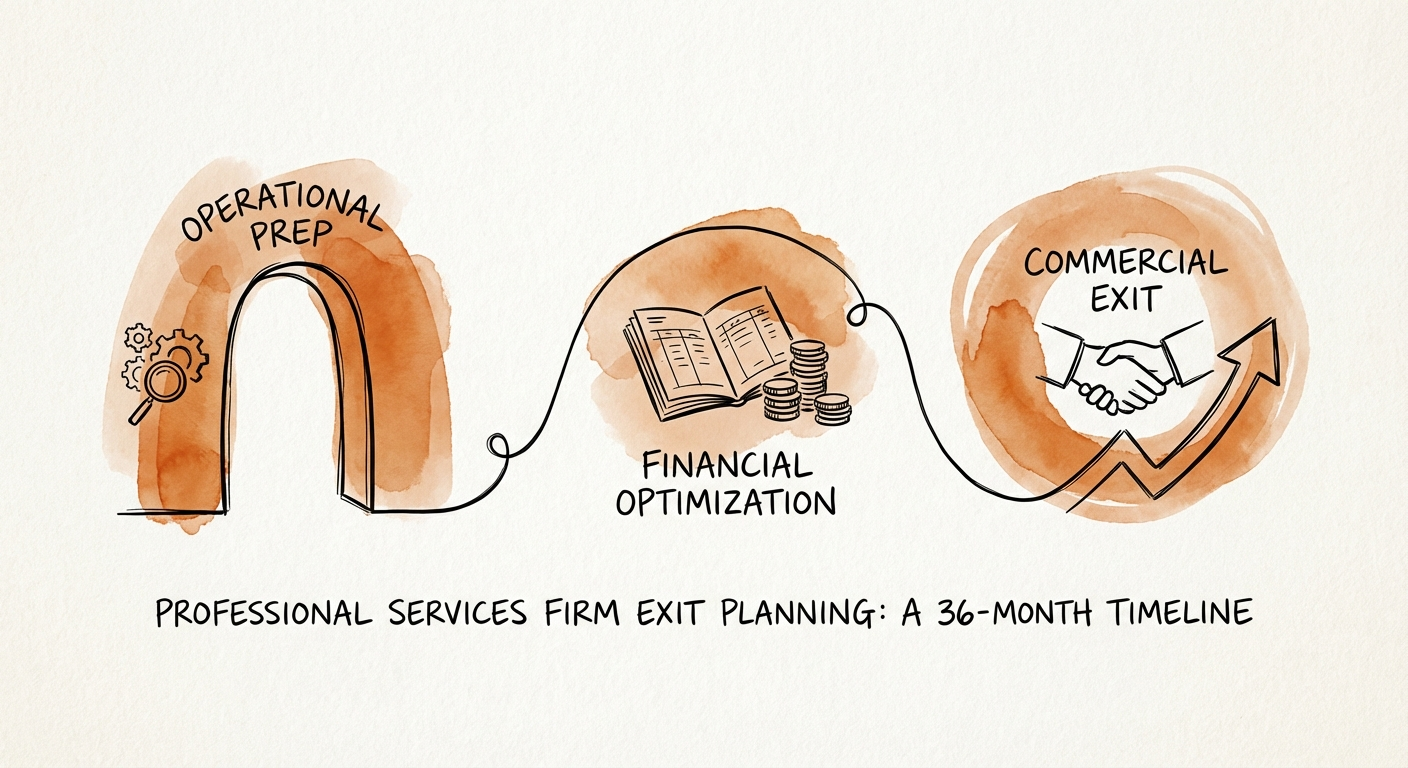
The 36-Month Exit: Why Selling Your Services Firm in 6 Months Is a Multi-Million Dollar Mistake
A diagnostic guide for 36-month exit planning. Learn why 6-month timelines fail and how to bridge the valuation gap from 4x to 10x EBITDA.
265% Higher EBITDA for Mature Firms
BRIEF · UNIT ECONOMICS
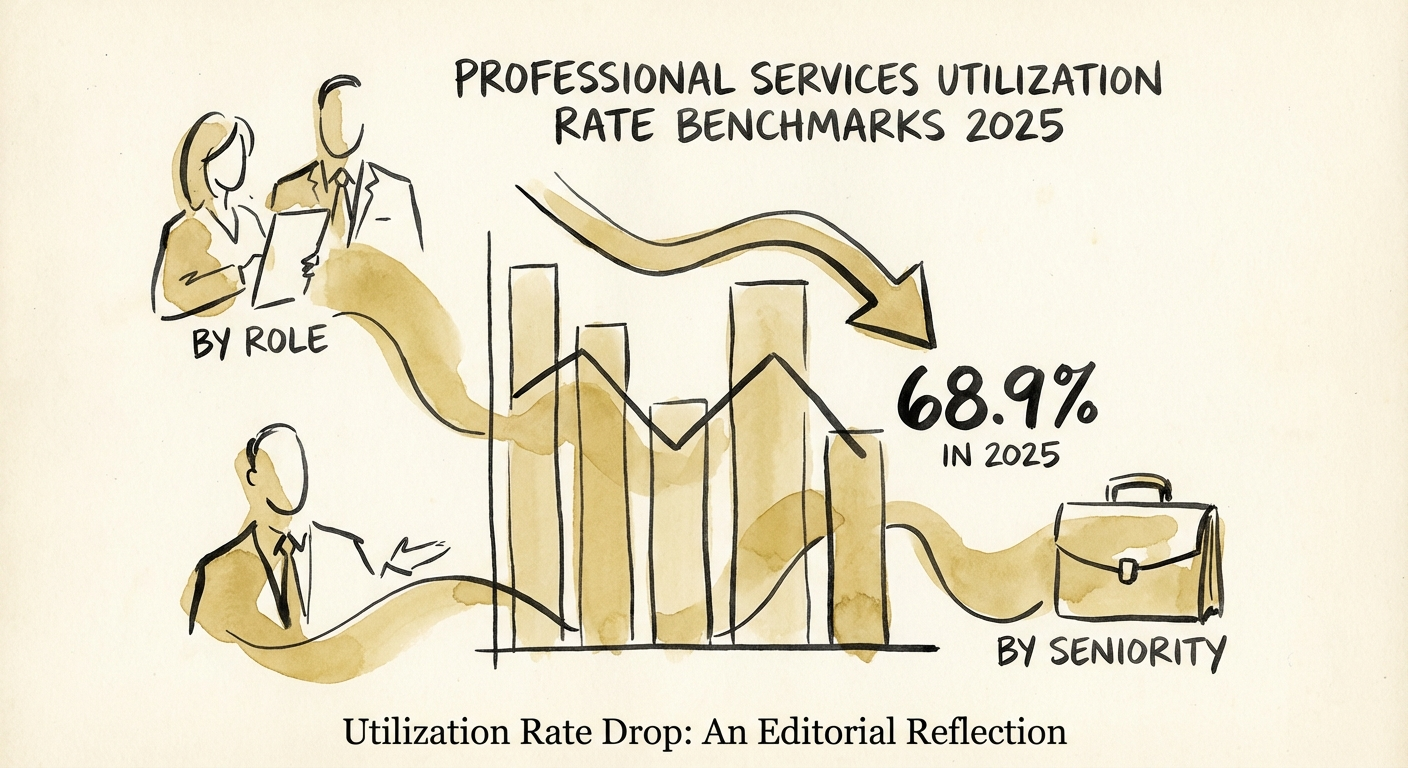
Professional Services Utilization Rate Benchmarks 2025: Why 68.9% Is the New Danger Zone
New 2025 data shows average billable utilization has dropped to 68.9%. See utilization targets by role (Junior to Partner) and how to fix the EBITDA leak.
68.9% Avg. 2025 Billable Utilization
BRIEF · UNIT ECONOMICS
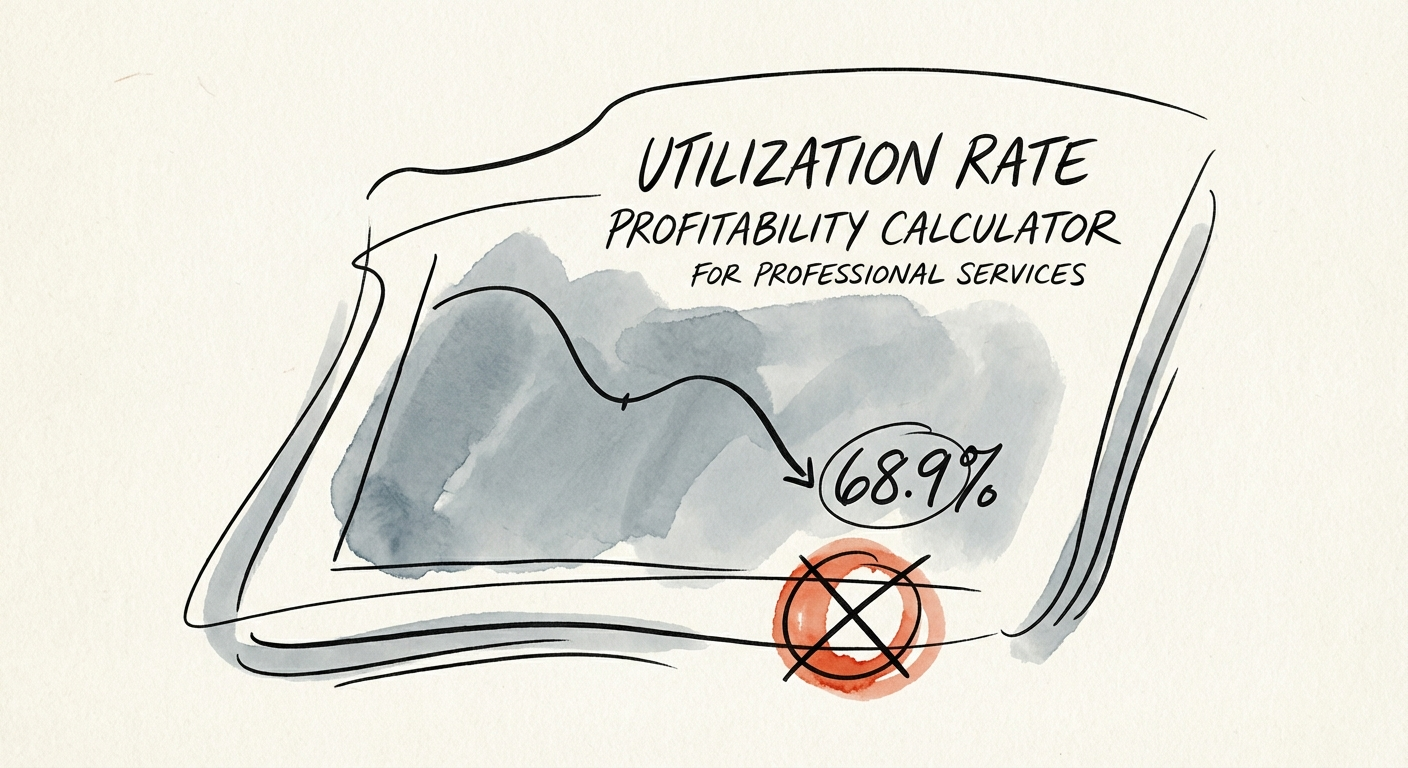
The Utilization Rate Lie: Why 68.9% Is the New "Danger Zone" for Services Profitability
New 2025 data shows average utilization has dropped to 68.9%, dragging EBITDA to 9.8%. Here is the calculator and playbook to fix it.
68.9% Avg. 2025 Utilization
BRIEF · PROJECT RECOVERY
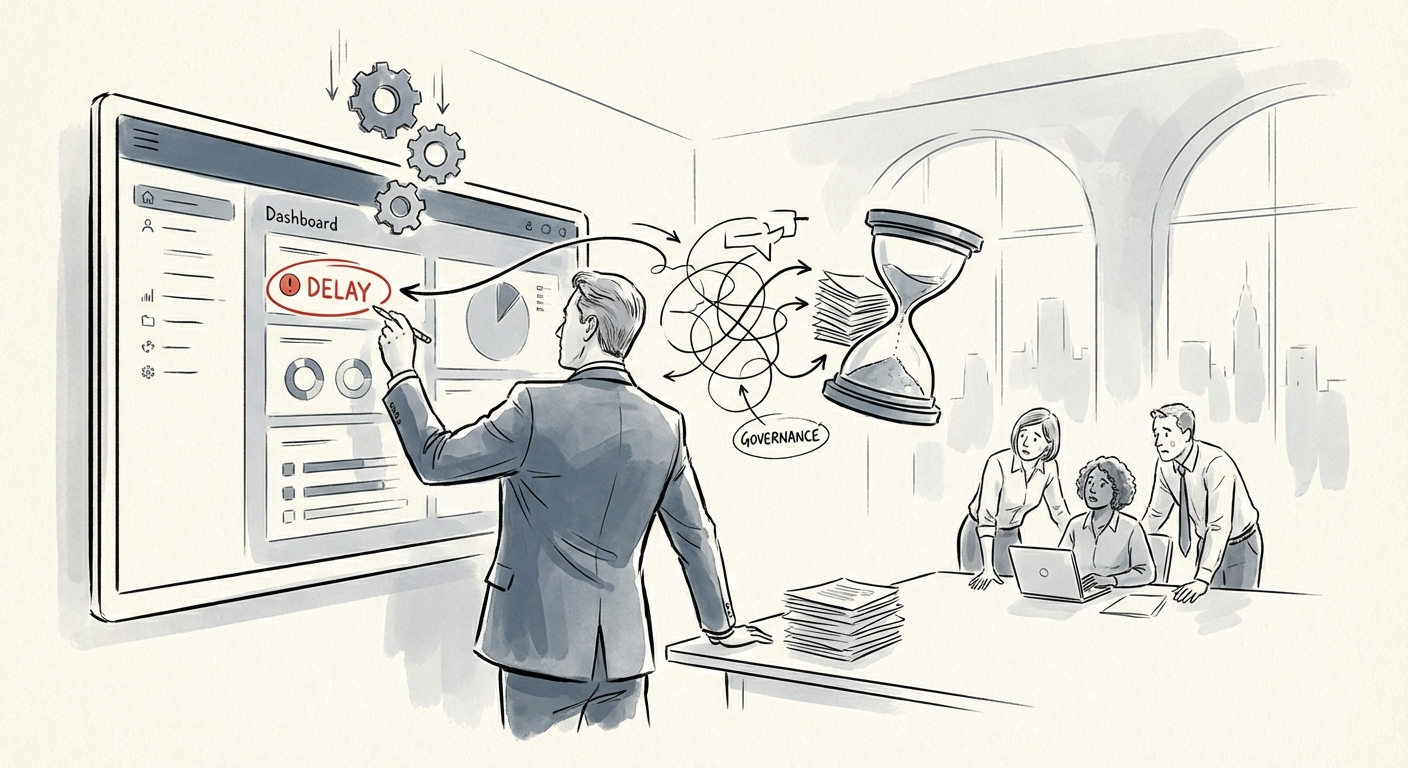
Why Your Project Governance Is Creating the Delays It's Meant to Prevent
Traditional project governance optimizes for blame avoidance, not speed. Data shows reducing decision latency improves project success rates by 40%. Here is the fix.
40% Success Rate Gap
BRIEF · PROJECT RECOVERY
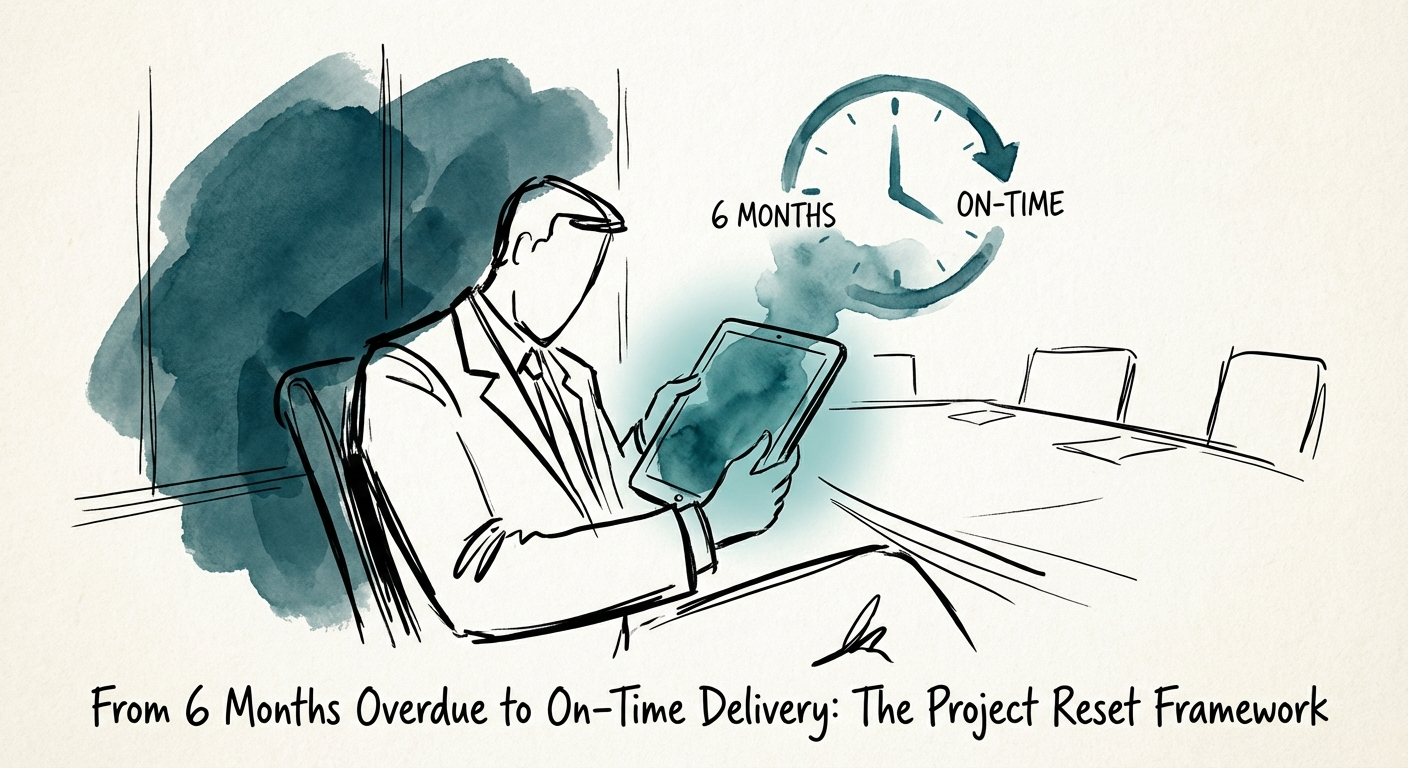
From 6 Months Overdue to On-Time Delivery: The Project Reset Framework
Stop the bleeding on stalled IT projects. Learn the 30-day Project Reset Framework that saves 200% budget overruns and restores board confidence.
200% Cost Overrun Risk
BRIEF · EXIT READINESS
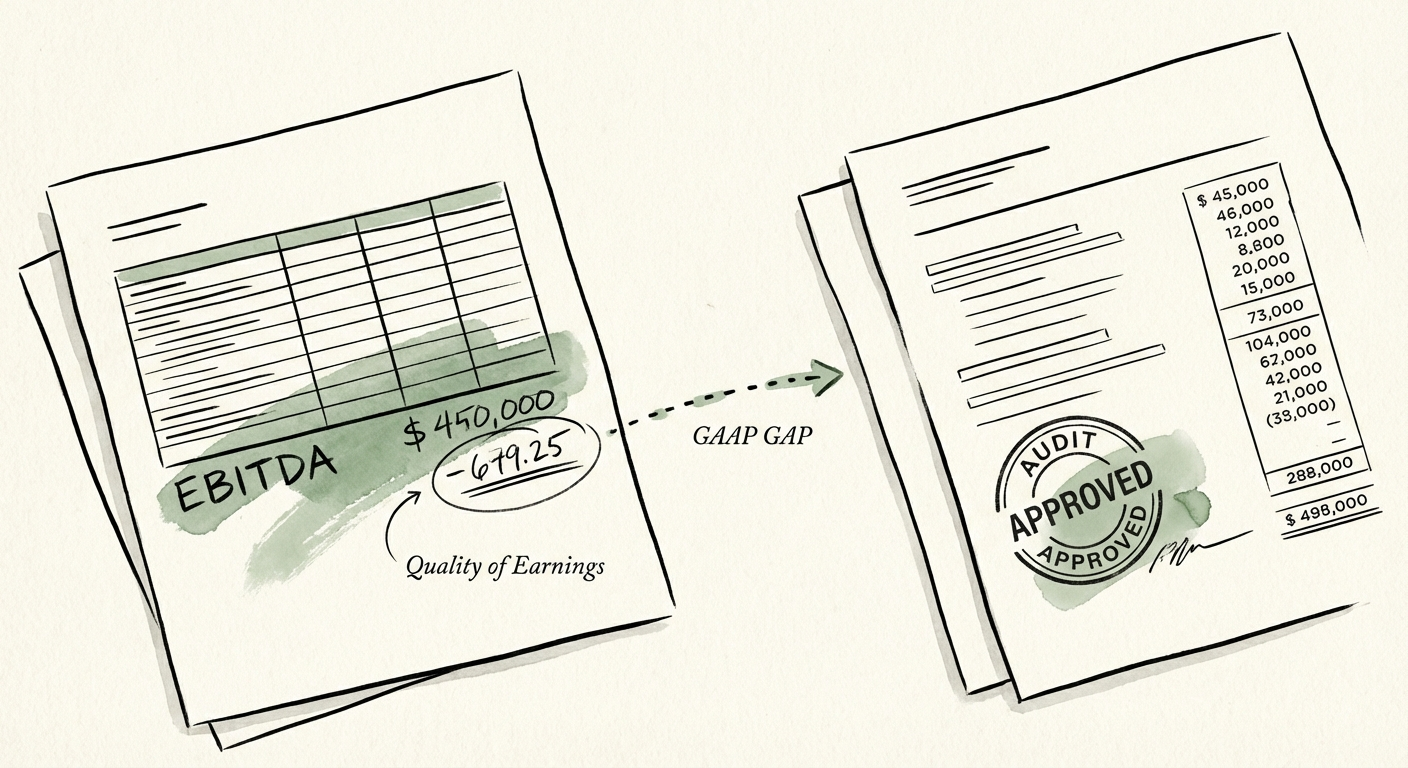
Quality of Earnings vs. Audit: The "GAAP Gap" That Kills 50% of Deals
A clean audit is not a clean bill of health. Discover why 50% of deals fail in due diligence and how Quality of Earnings (QoE) reveals the risks GAAP hides.
50% Deal Failure Rate in Due Diligence
BRIEF · TECHNICAL DEBT
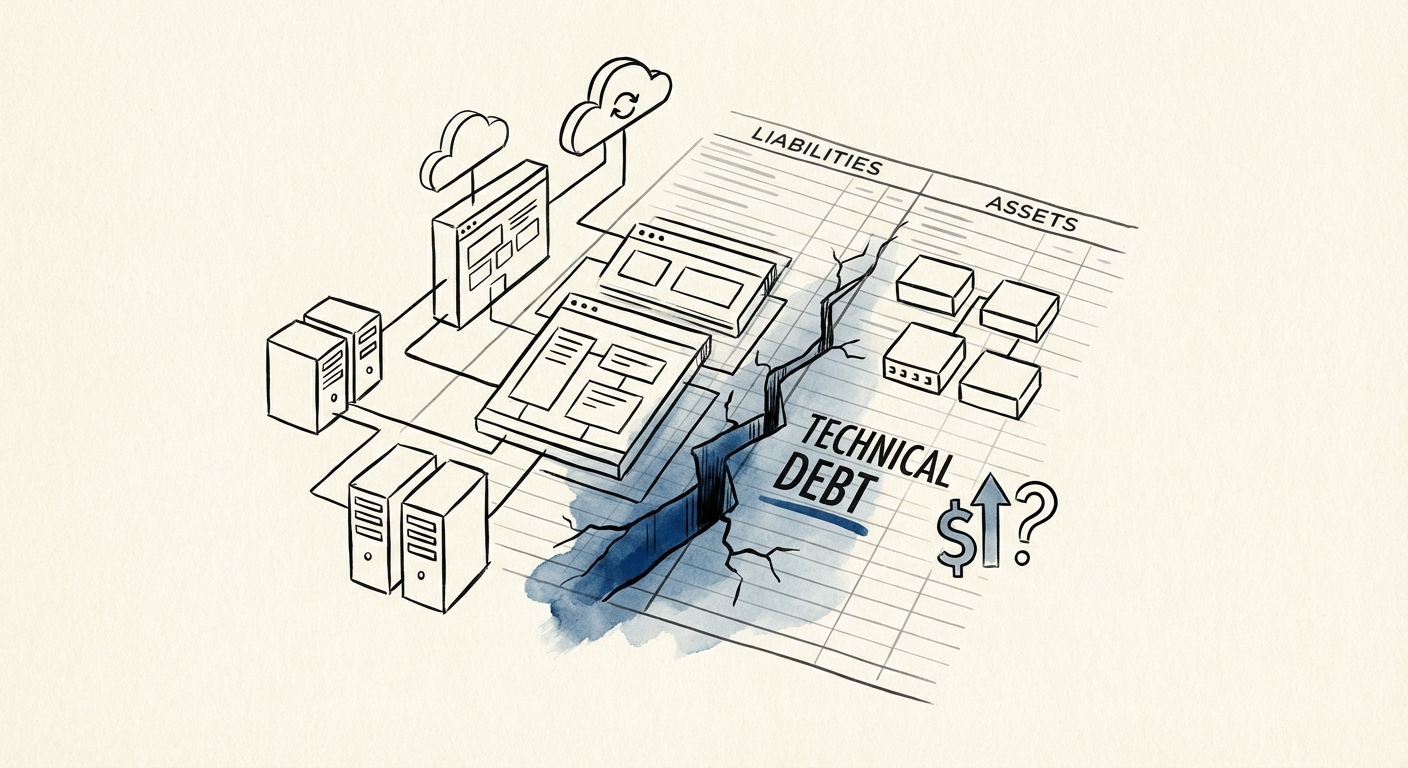
The Debt Ceiling: How to Quantify Technical Debt in Dollars for Board Presentations
Stop talking about 'refactoring.' Learn how to quantify technical debt in dollars using the Maintenance Tax and Opportunity Cost framework. Benchmarks included.
42% Developer Time Wasted on Maintenance