BRIEF · FINANCIAL INFRASTRUCTURE
When the Board Loses Confidence: Rebuilding Trust After a Miss
58% of PE-backed CEOs are replaced within two years. Learn the 90-day protocol to rebuild board confidence after missing a quarterly forecast.
58% CEO Replacement Rate
BRIEF · GTM EXECUTION
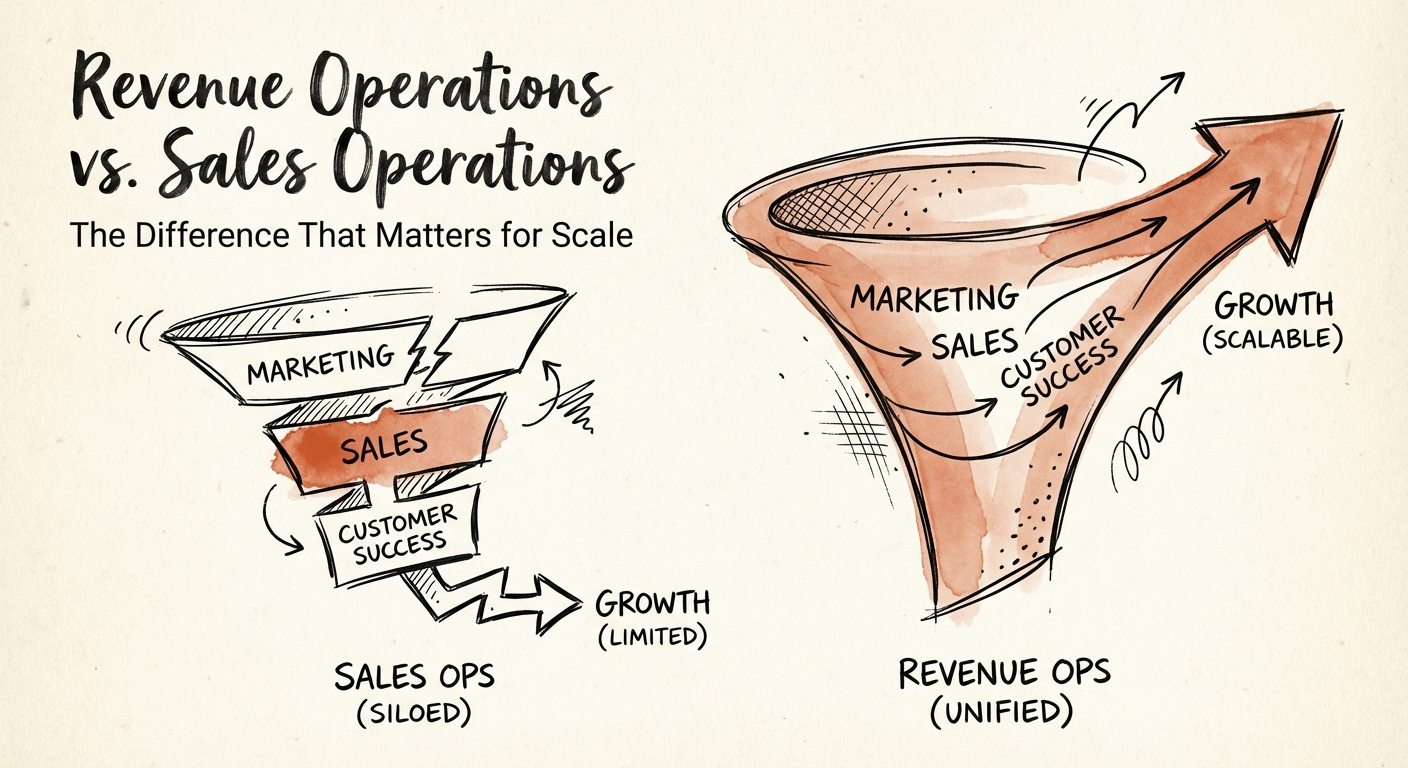
RevOps vs. Sales Ops: The $10M ARR Crossover Where the Org Chart Breaks
Two definitions of "qualified lead," two forecasts, two data models. Here's the structural fix B2B tech CEOs need crossing $10M ARR, and who it should report to.
19% Faster Revenue Growth
BRIEF · EXIT READINESS
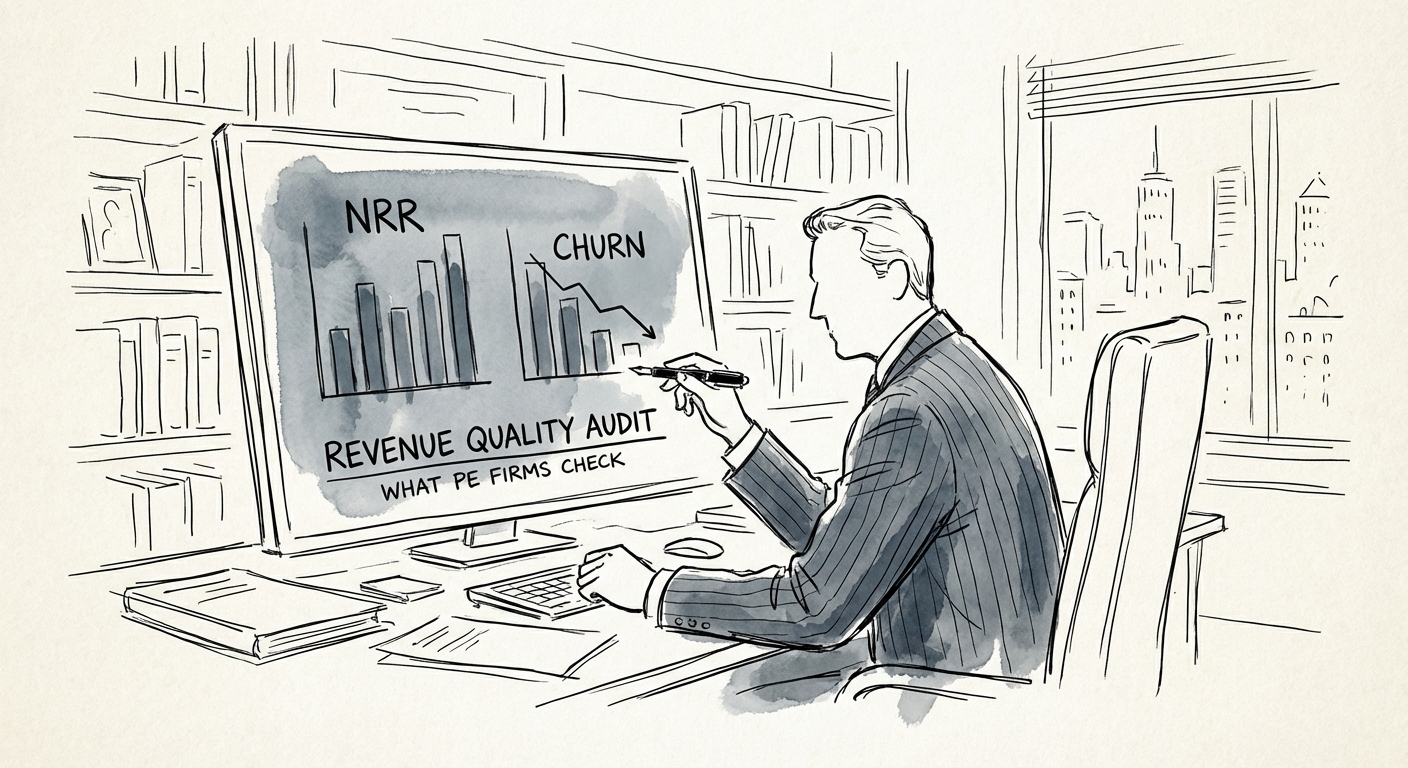
The Revenue Quality Audit: What PE Firms Check Before Writing a Check
Stop fixating on EBITDA. In 2026, PE buyers pay a 63% premium for revenue durability. Here is the exact audit framework Operating Partners use to prep exits.
63% Valuation Premium for High NRR
BRIEF · EXIT READINESS
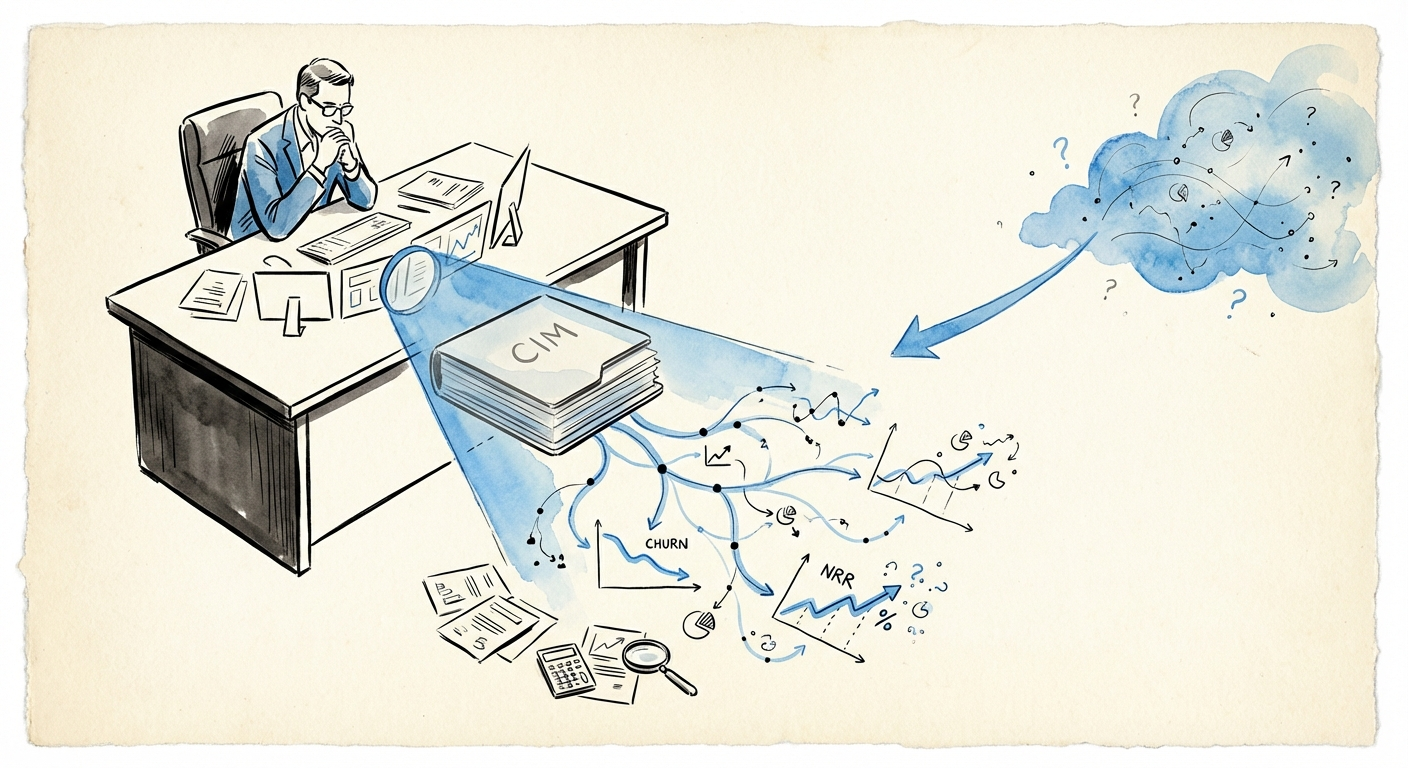
The Revenue Quality Audit: 15 Questions That Reveal What the CIM Hides
Stop buying 'hollow' revenue. These 15 diagnostic questions reveal the true quality of earnings (QoE) in PE targets, covering NRR, concentration, and churn.
63% Valuation Premium for NRR >120%
BRIEF · FINANCIAL INFRASTRUCTURE
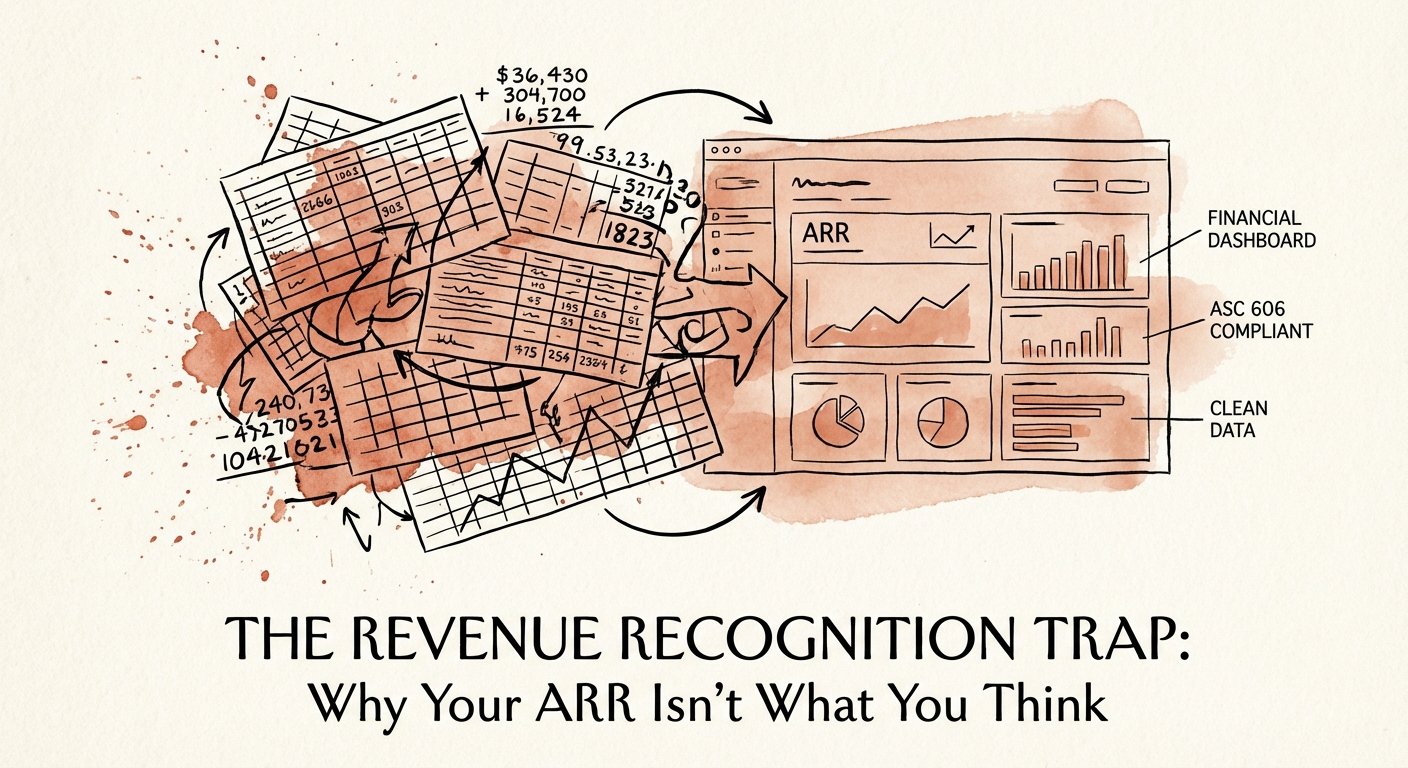
The Revenue Recognition Trap: Why Your ARR Isn't What You Think
Founders often confuse bookings with revenue. Discover why ASC 606 errors can inflate your ARR by 40% and reduce your exit value during due diligence.
18% Term Sheets Withdrawn in Diligence
BRIEF · UNIT ECONOMICS
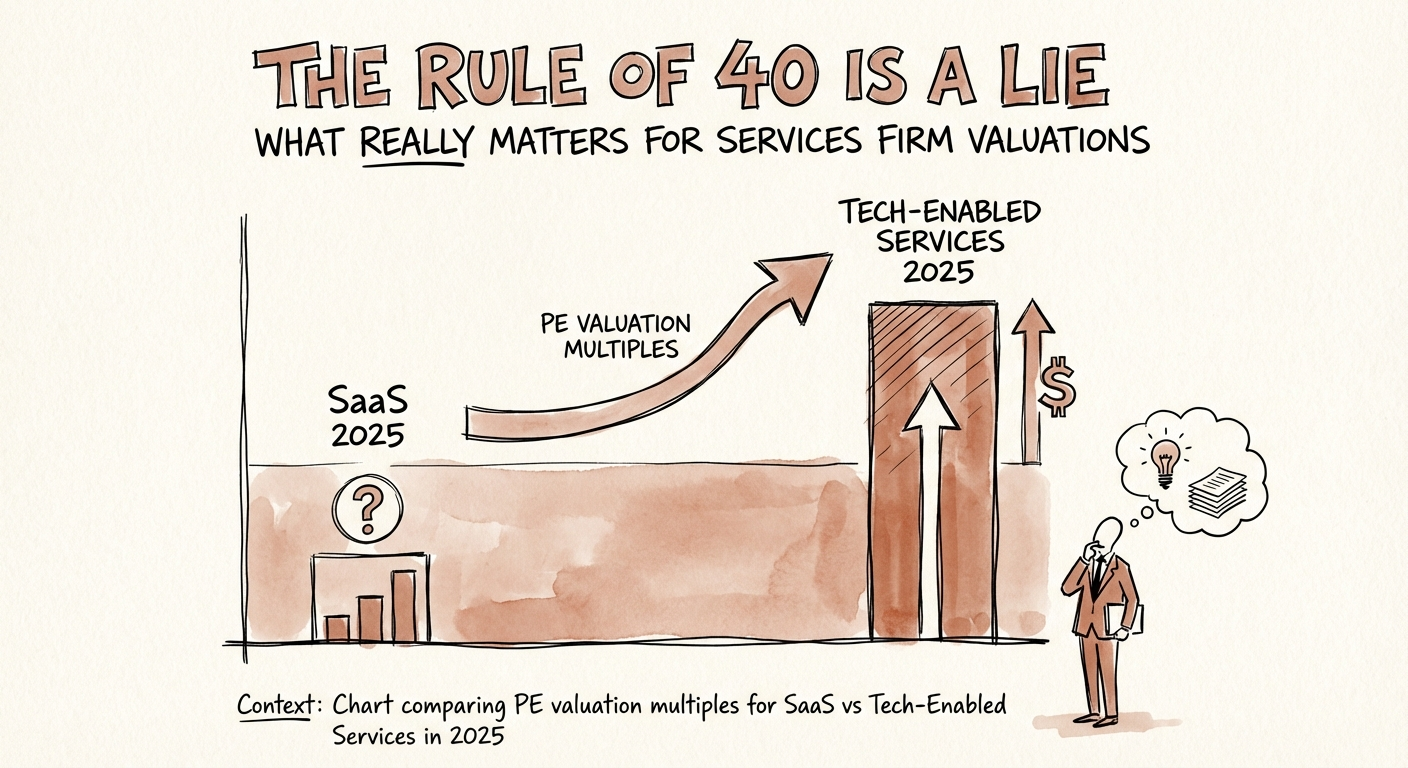
The Rule of 40 Is a Lie: What Really Matters for Services Firm Valuations
Why PE firms applying SaaS metrics to services companies destroys value. The 2025 valuation guide: EBITDA multiples, gross margin targets, and the 'Rule of 50' for services.
10.8x Median EBITDA Multiple (High-Value Services)
BRIEF · EXIT READINESS
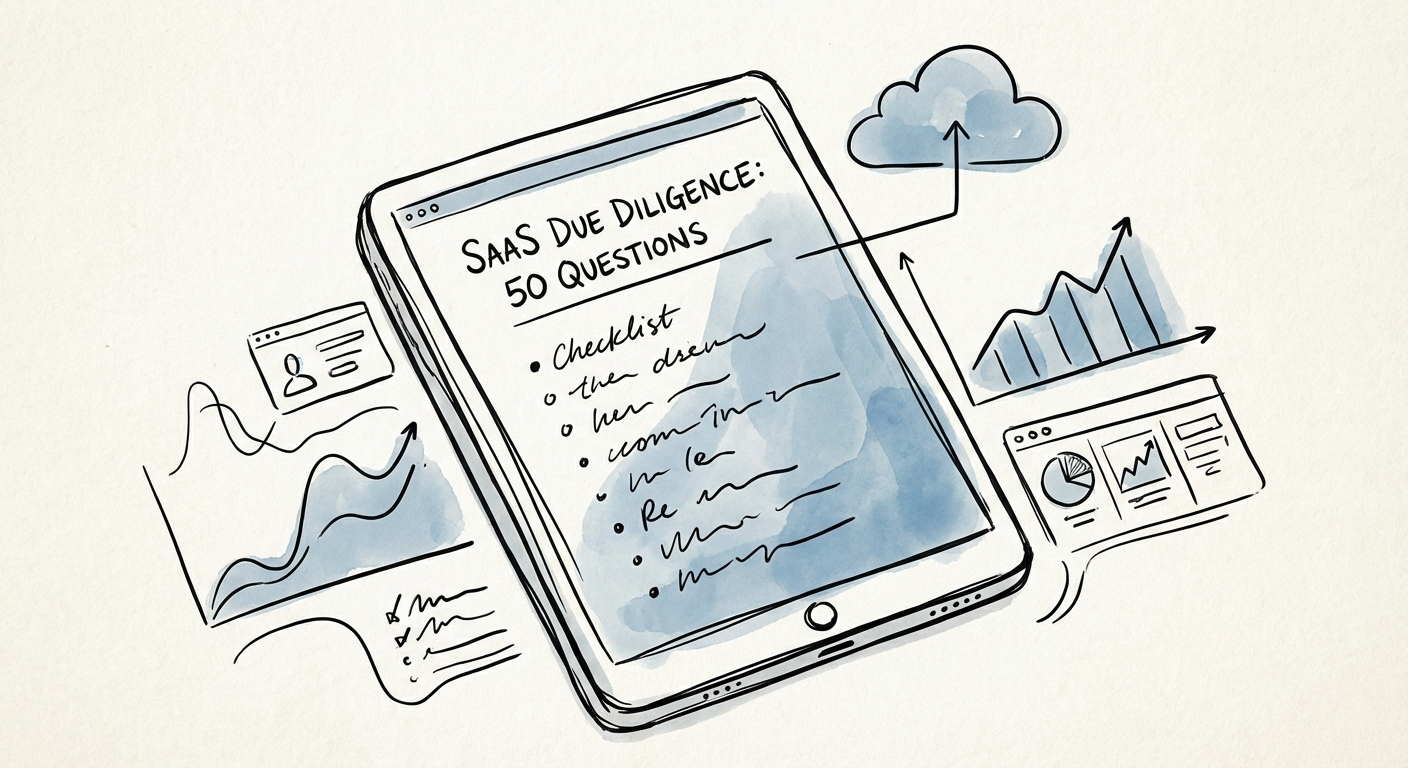
SaaS Company Due Diligence: The 50 Questions Investors Always Ask
Don't let your deal die in diligence. The comprehensive 50-question checklist for SaaS founders and PE sponsors covering revenue quality, technical debt, and legal risks. 2026 Benchmarks included.
47% Deal Failure Rate During Diligence
BRIEF · UNIT ECONOMICS
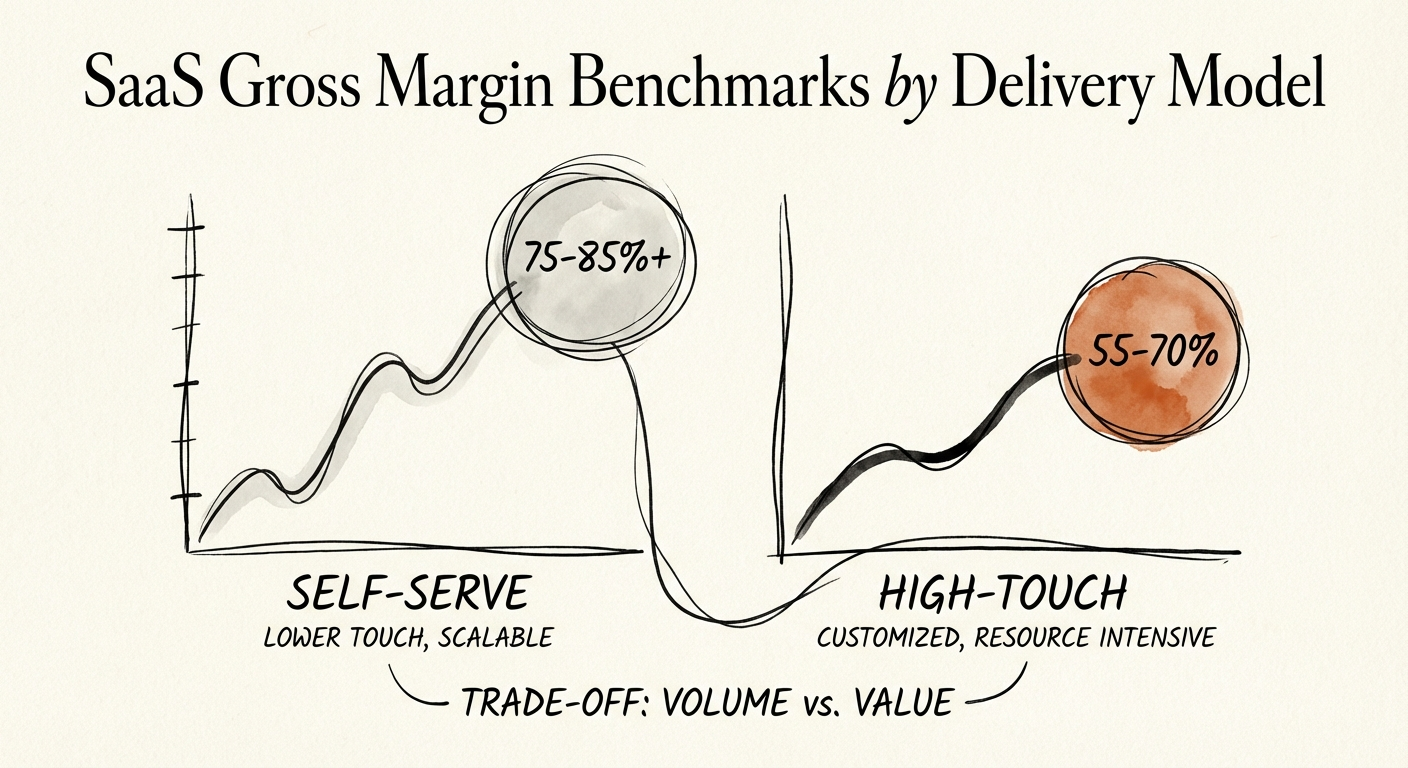
The Gross Margin Lie: Why Your "High-Touch" Model Is Bleeding EBITDA
Benchmarks for SaaS gross margins in 2026. Data shows a 7% spread between subscription and total margins. Learn why high-touch models bleed EBITDA.
71% Median Total Gross Margin
BRIEF · UNIT ECONOMICS
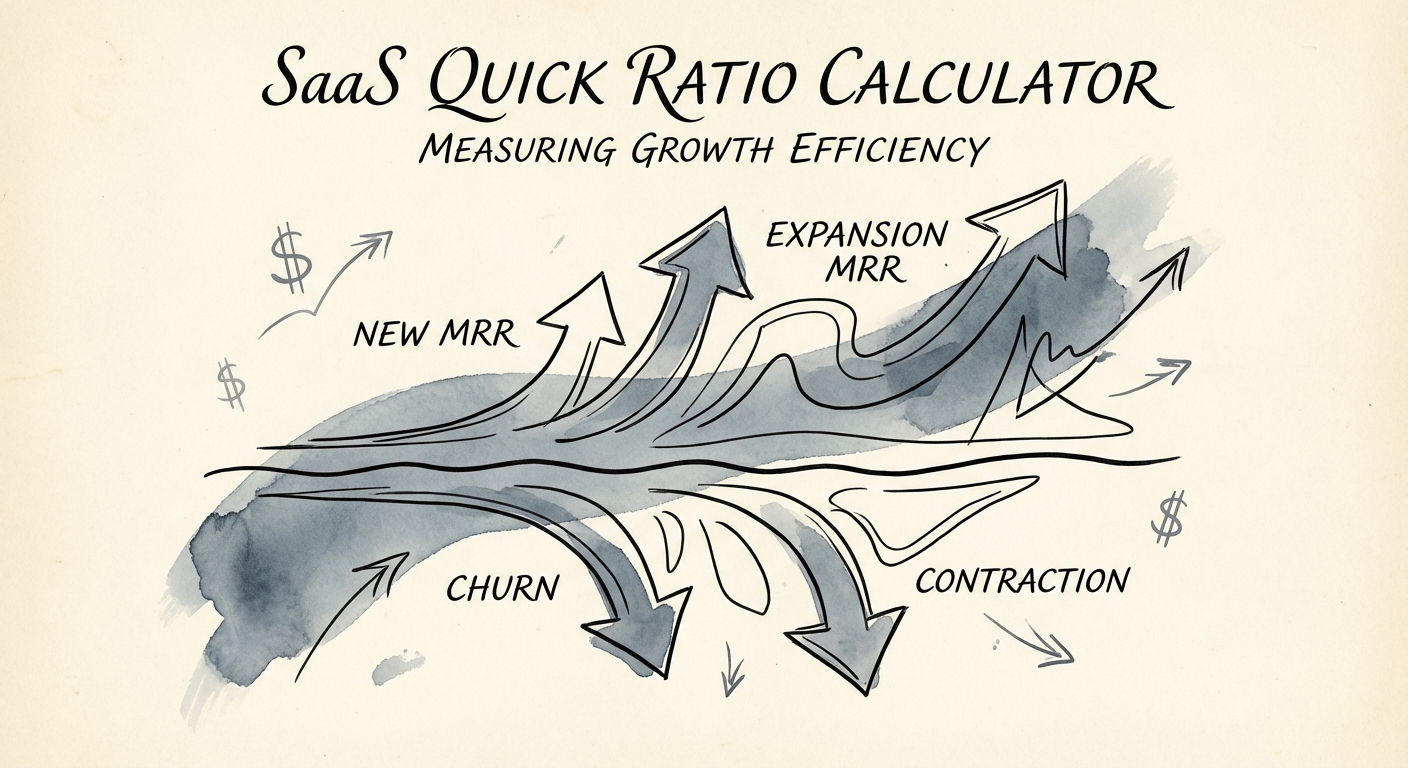
SaaS Quick Ratio: The Metric That Reveals If Your Growth Is Real or Just a Hallucination
Calculate your SaaS Quick Ratio with the formula used by top VCs. Discover why a ratio under 4.0 kills Series B valuations and how to fix growth efficiency.
4.0 Target Quick Ratio
BRIEF · GTM EXECUTION
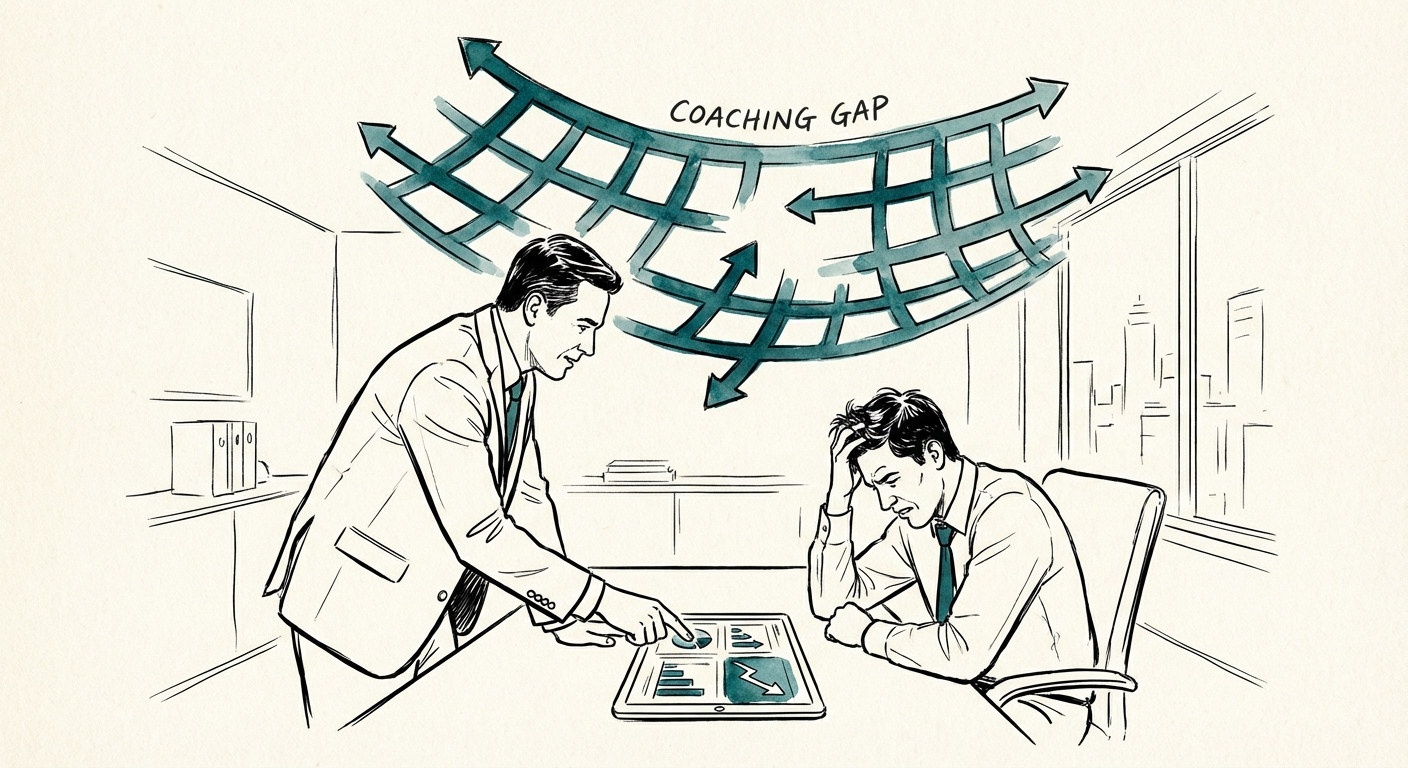
7 Signs Your Sales Team Has a Coaching Problem, Not a Hiring Problem
Data shows 84% of sales reps missed quota in 2024. Before you fire your VP of Sales, check these 7 signs that your problem is coaching, not hiring.
16% Reps Hitting Quota (2024)
BRIEF · GTM EXECUTION
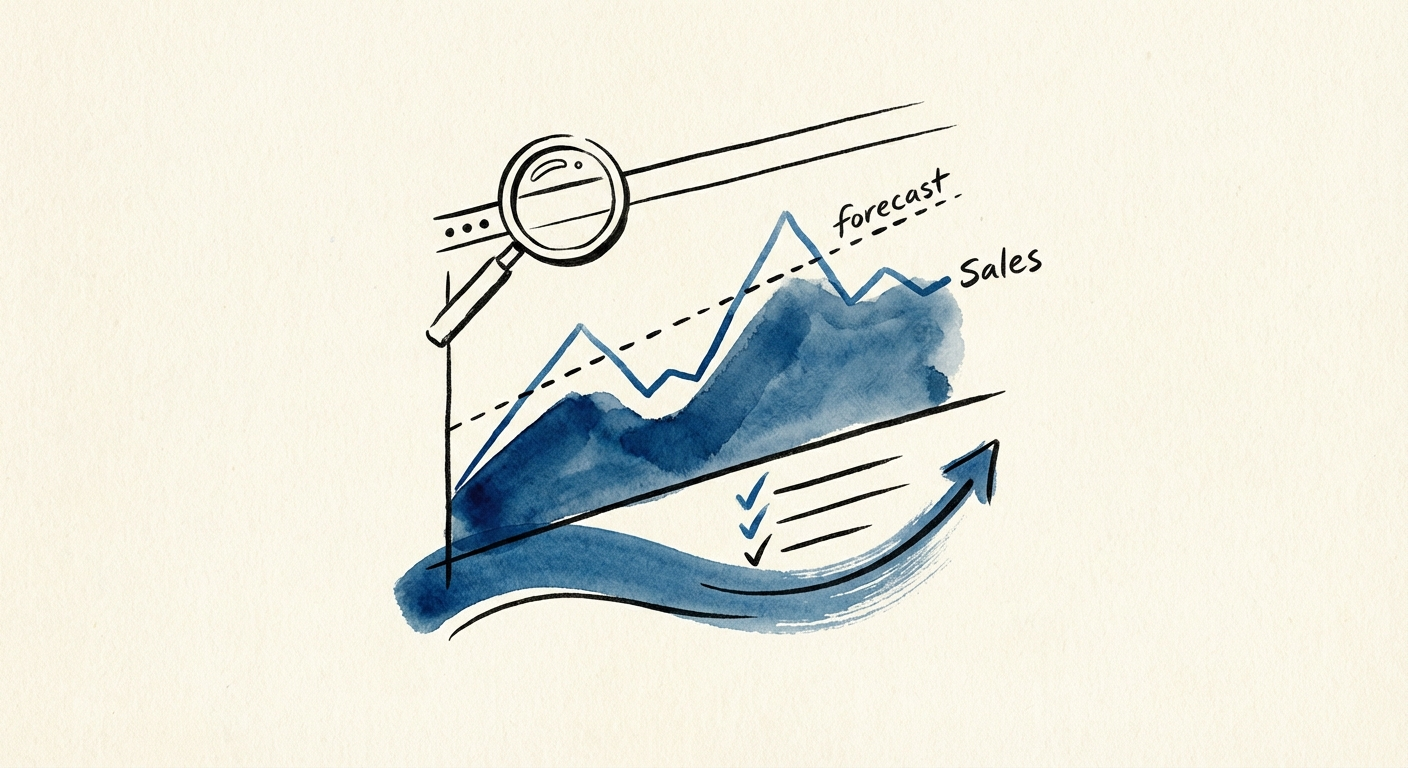
Sales Forecasting Accuracy Audit: The 20-Point Diagnostic for Series B CEOs
Use this 20-point sales forecasting diagnostic to move from 'gut feel' to 90%+ accuracy. For Series B/C CEOs and Operating Partners.
58% Performance Gap
BRIEF · GTM EXECUTION
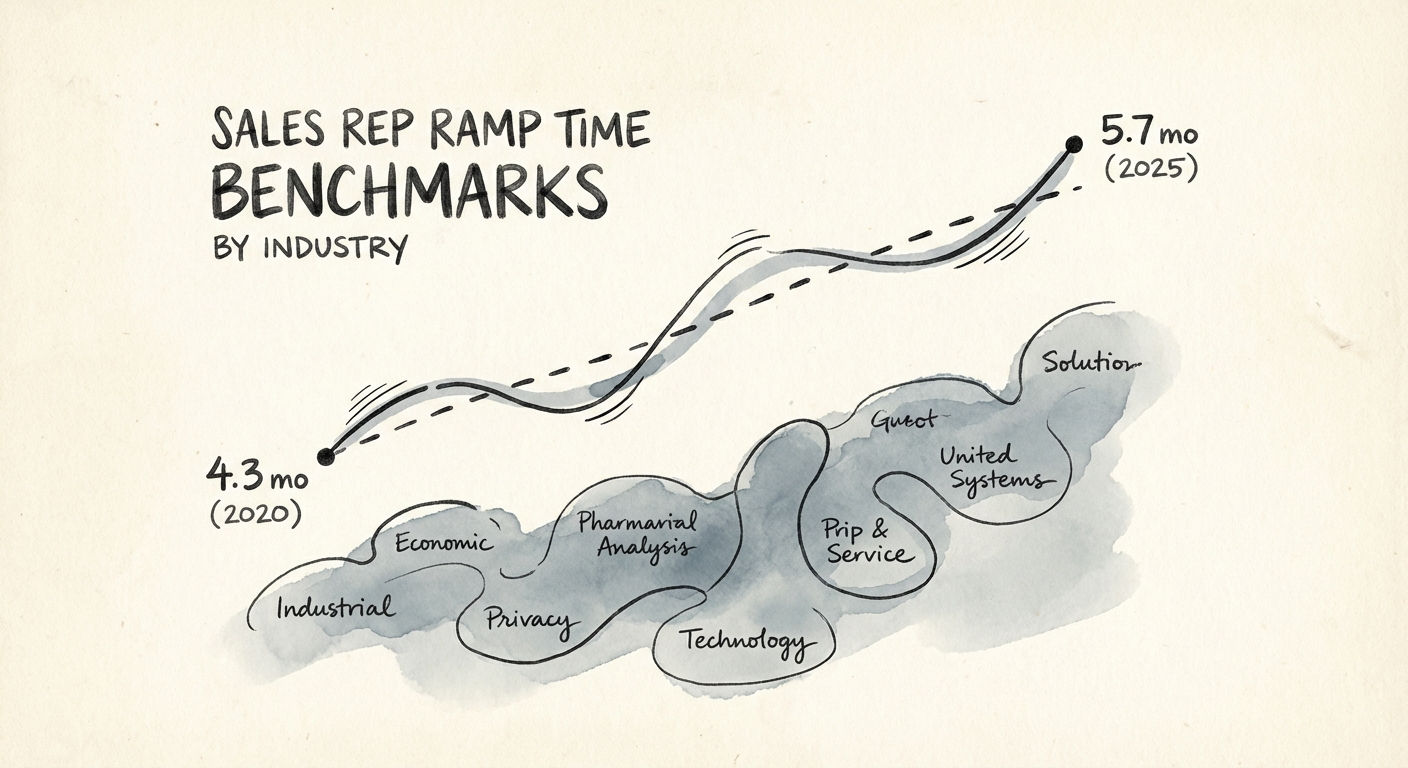
Sales Rep Ramp Time Benchmarks: Why 5.7 Months is the New 'Danger Zone'
Compare 2026 B2B sales ramp benchmarks by SMB, mid-market, enterprise, ACV, and quota. See when ramp time becomes a CAC payback problem.
5.7 Months Avg. B2B Ramp Time
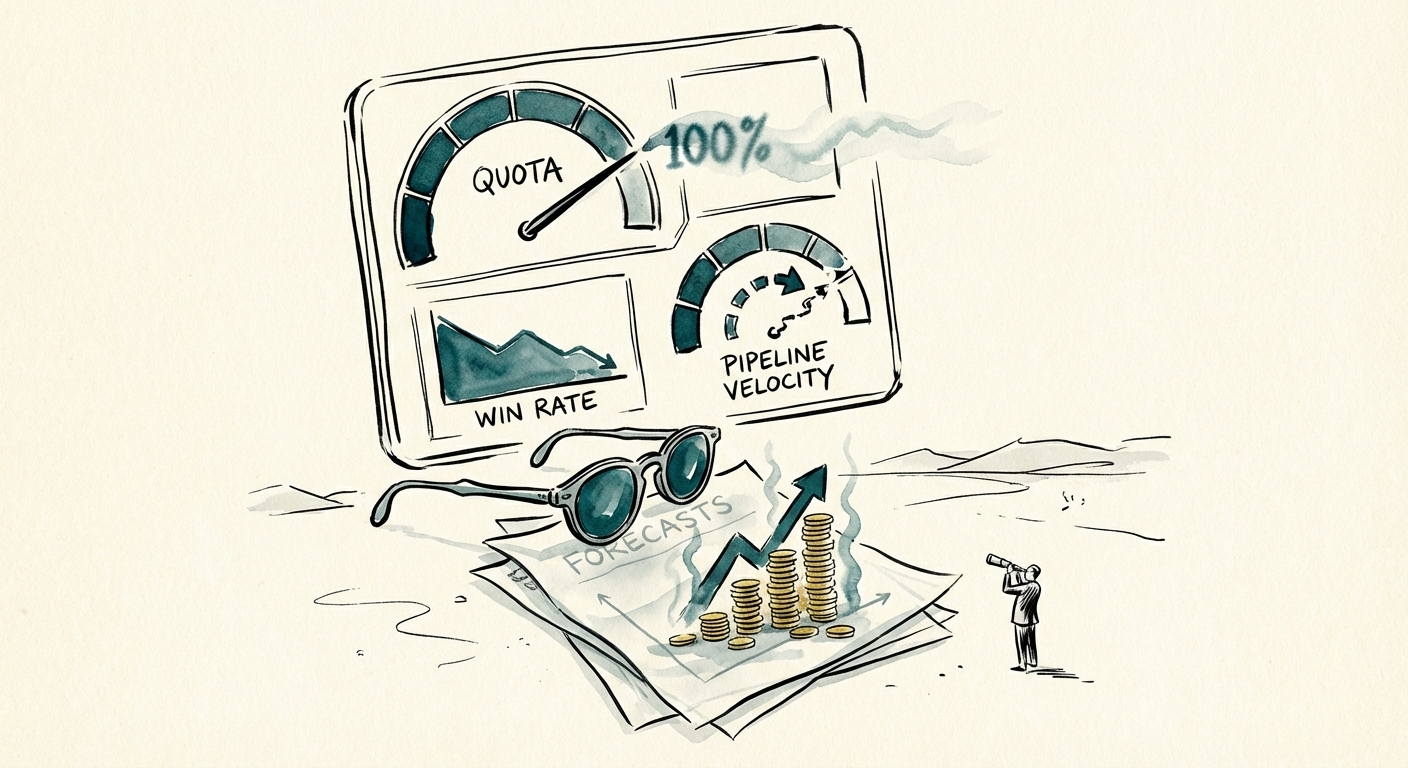
BRIEF · GTM EXECUTION
The 25-Point Sales Diagnostic: Why Your Revenue Forecast Is a Hallucination
Stop guessing at revenue. Audit your sales team with these 25 metrics. New 2025 benchmarks for Series B/C: Quota attainment (43%), Ramp time (5.7 months), and CAC Payback.
43% Avg. Quota Attainment (2025)
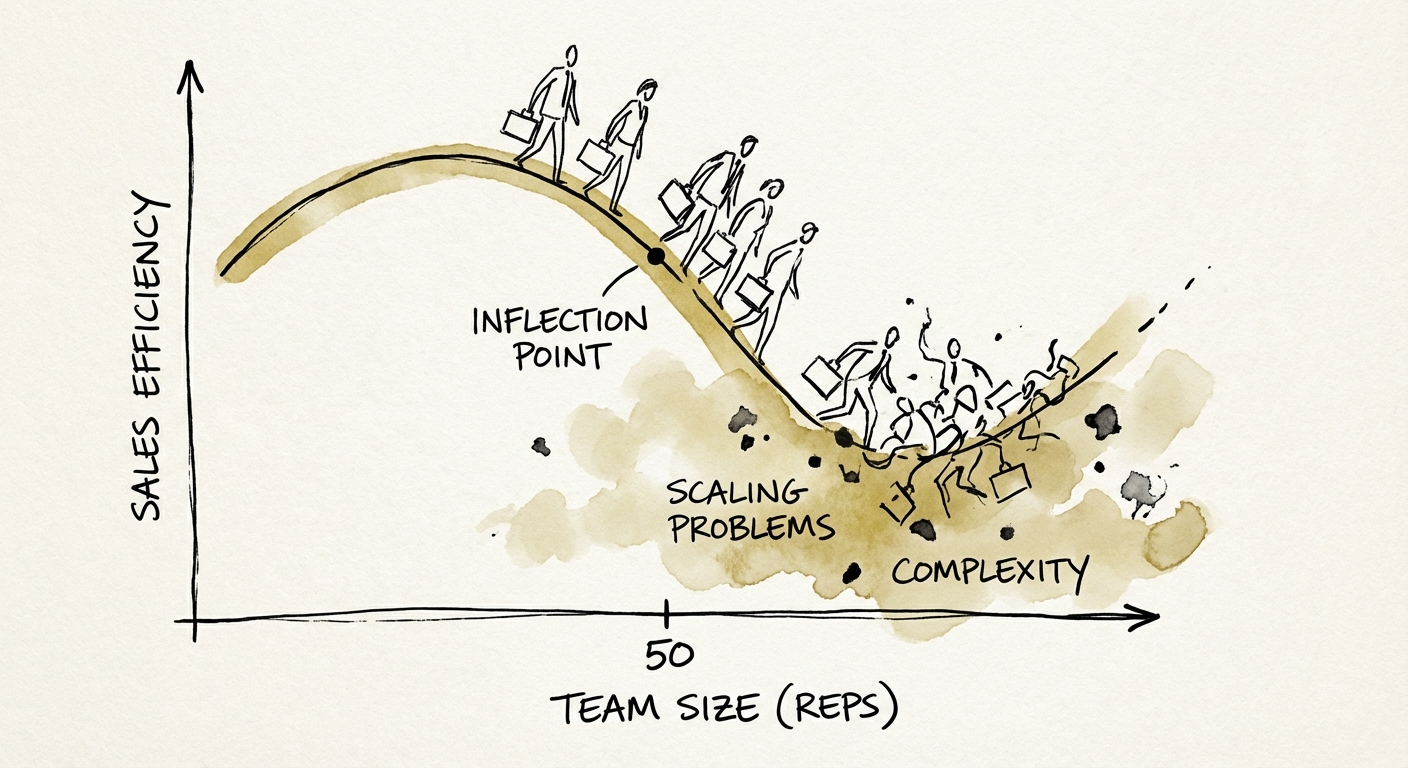
BRIEF · GTM EXECUTION
When Scaling Sales Means Scaling Problems: The 50-Rep Inflection Point
Data shows 57% of reps miss quota at scale. Learn why the 50-rep mark kills efficiency and how to install the management layer needed to survive.
43.1% Avg. Rep Quota Attainment (2025)
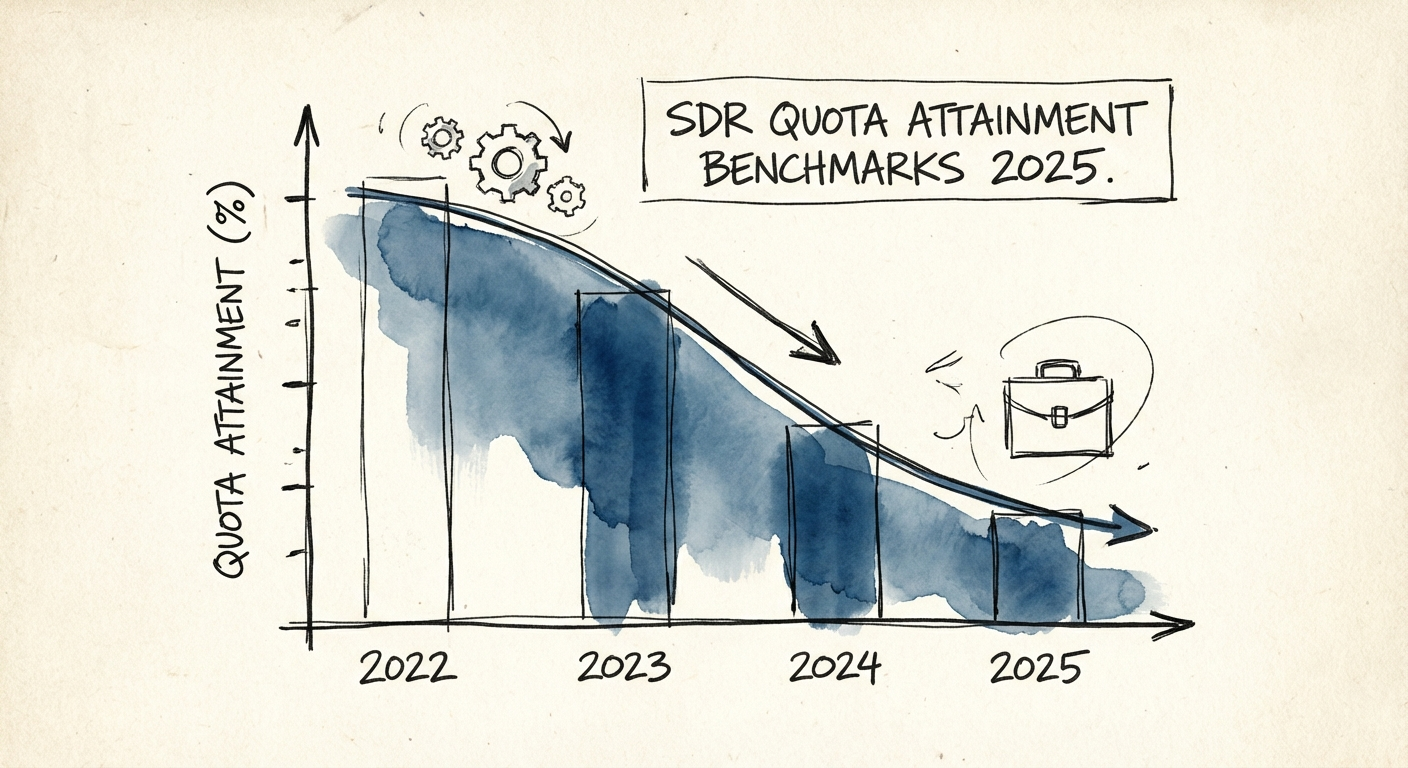
BRIEF · GTM EXECUTION
The Broken Factory: SDR Quota Attainment Benchmarks 2025
New 2025 data: Average SDR quota attainment has dropped to 43%. See the full benchmarks for ramp time, activity, and pipeline contribution.
43% Avg. SDR Quota Attainment
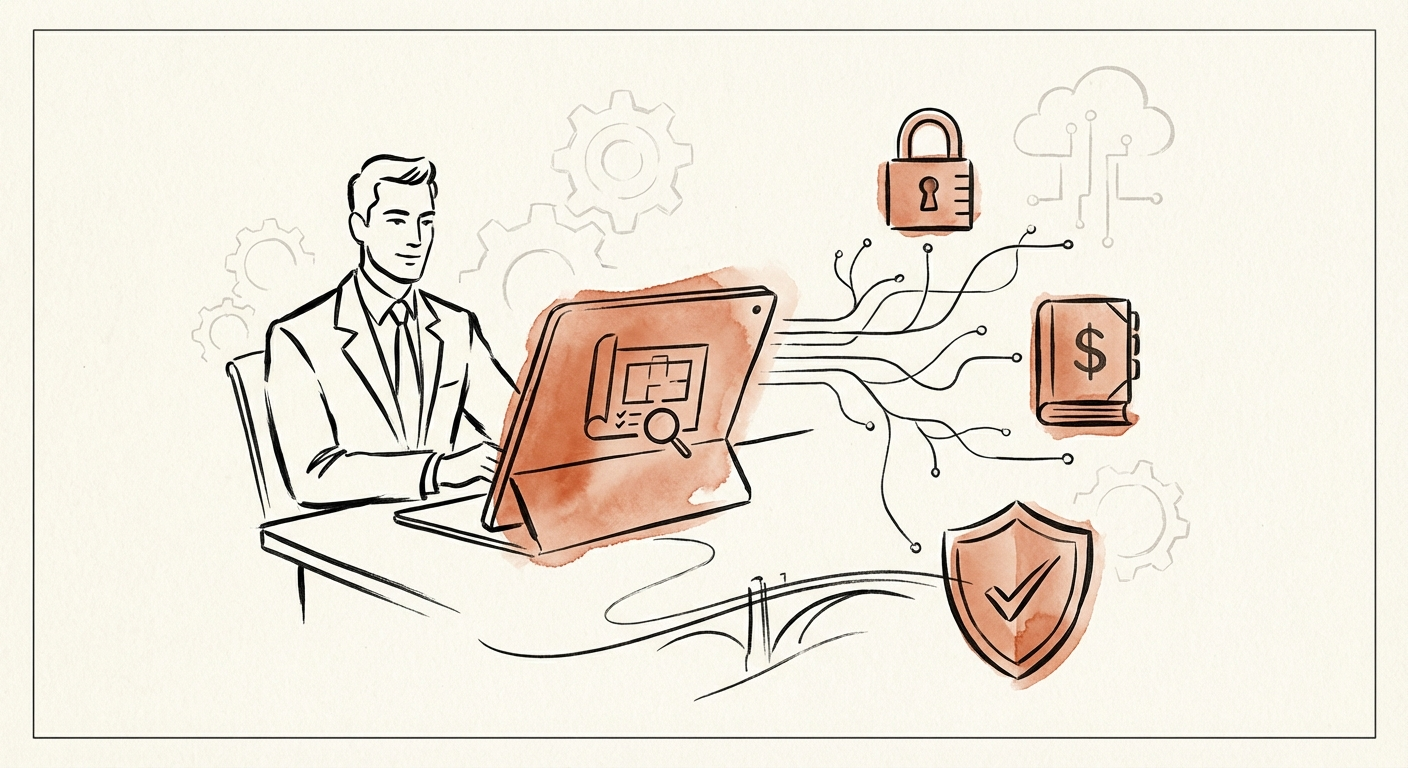
BRIEF · COMPLIANCE & SECURITY
Why Security Debt Can Change a Deal: How to Spot It Before Signing
Security debt can change price, structure, and post-close risk. Learn how to identify material cyber exposure before signing.
53% Buyers finding issues post-close
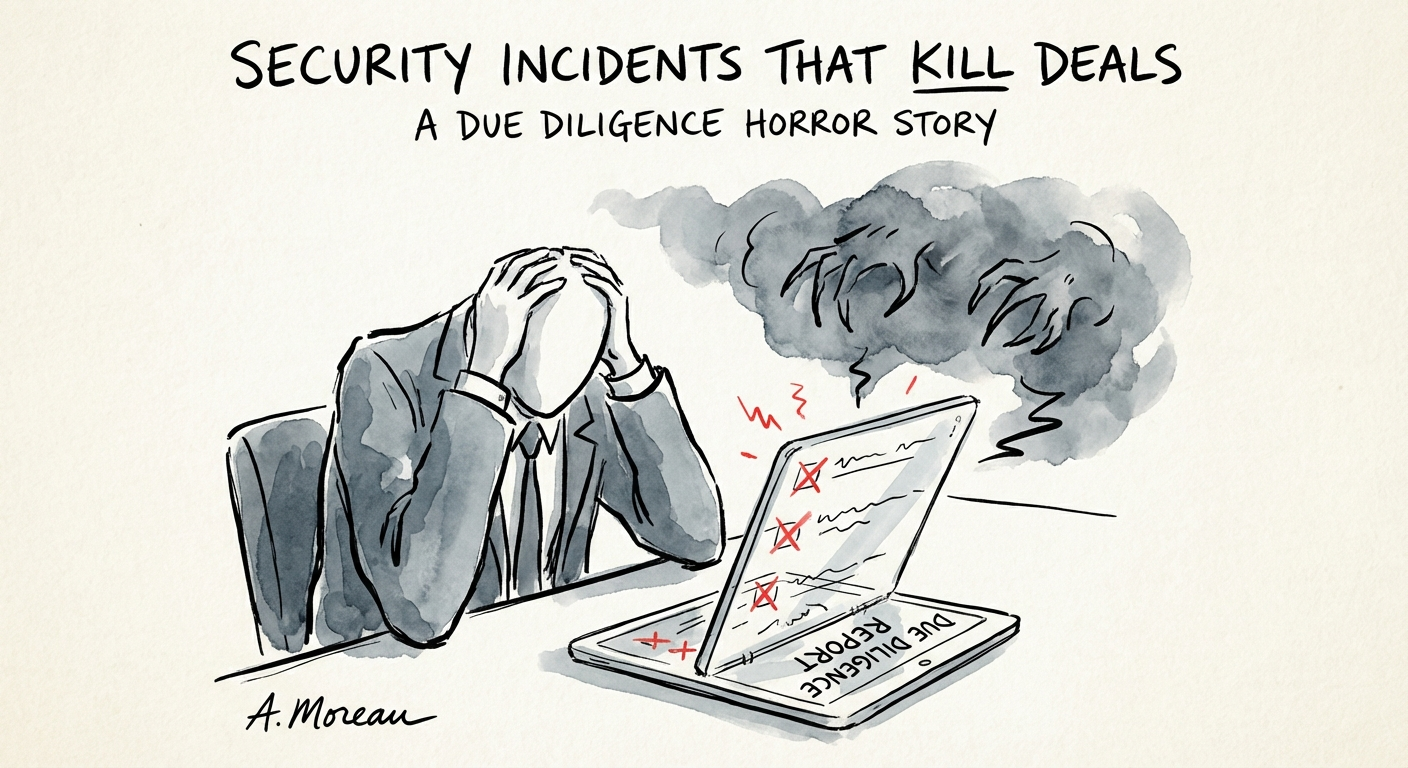
BRIEF · COMPLIANCE & SECURITY
The Security Posture Assessment: A Due Diligence Checklist for Protecting Deal Value
Standard IT due diligence misses 53% of security risks. Use this operator-led security posture assessment checklist to protect deal value and avoid the $4.88M average breach liability.
$4.88M Avg. Cost of Data Breach (2024)
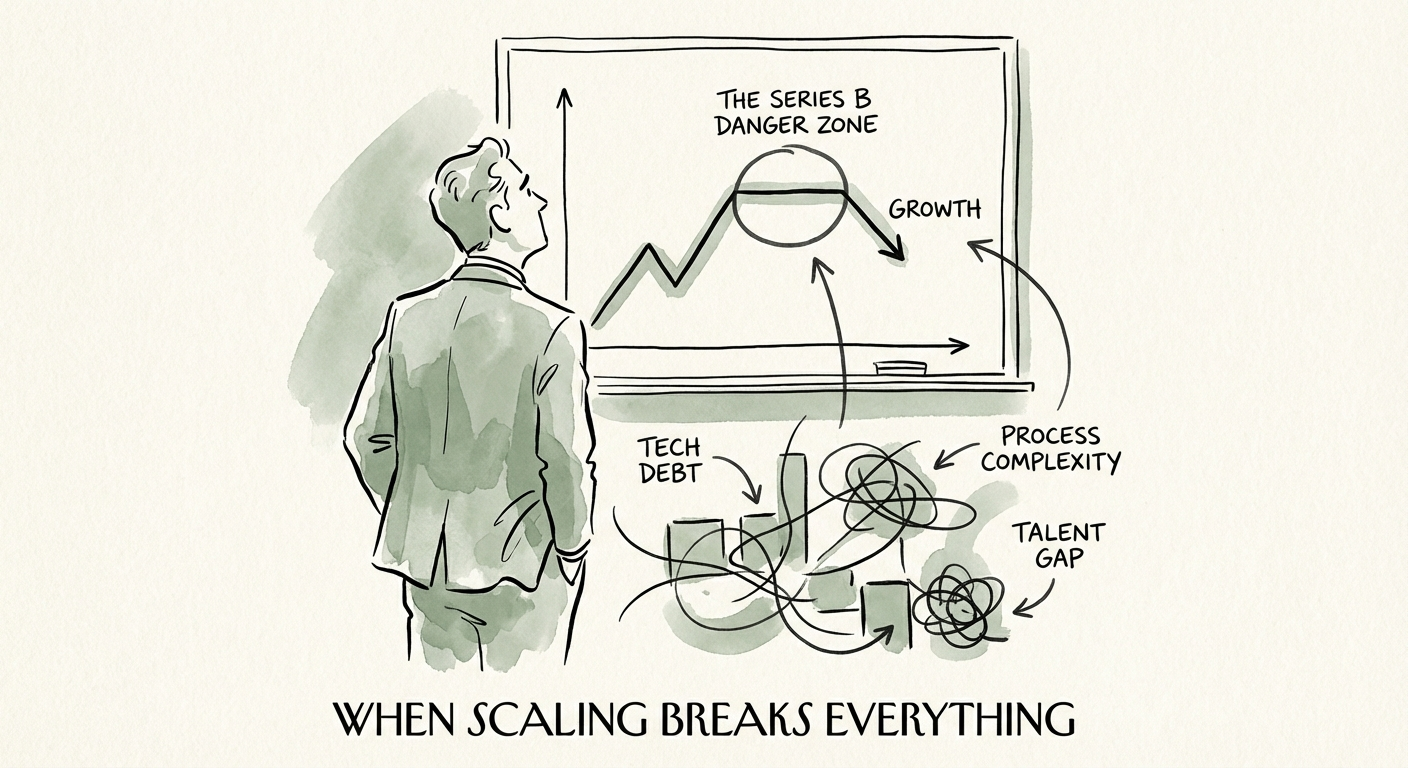
BRIEF · PROCESS DOCUMENTATION
The Series B Danger Zone: When Scaling Breaks Everything That Got You Here
Series B startups often face a 20% valuation discount due to key person risk. Learn how to shift from founder heroics to scalable process documentation.
20% Valuation Discount (Key Person Risk)
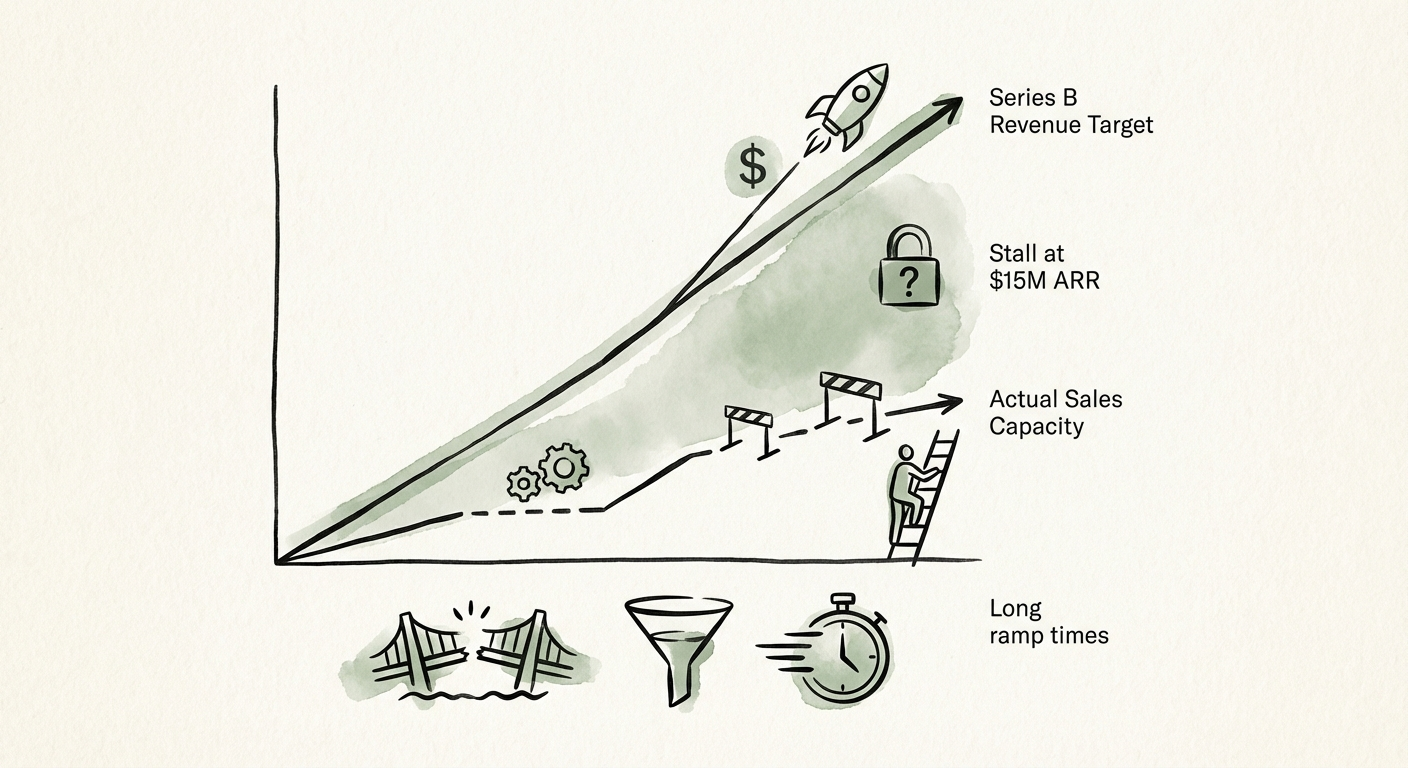
BRIEF · GTM EXECUTION
The Series B GTM Readiness Assessment: Why Scale-Ups Stall at $15M ARR
70% of Series B companies stall between $10M and $30M ARR. Use this 4-point GTM diagnostic to assess sales ramp, forecast accuracy, and leadership readiness.
5.7 Months Avg. Sales Rep Ramp Time
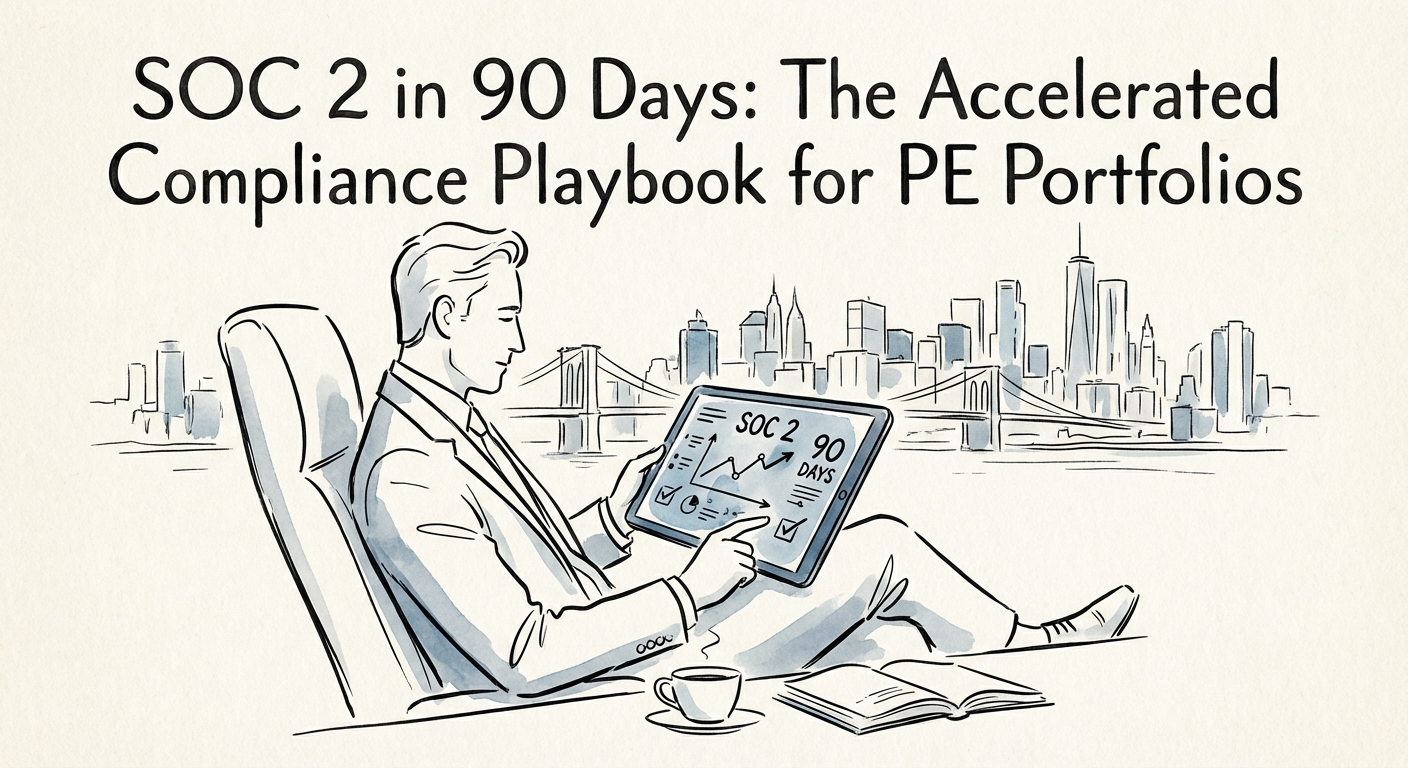
BRIEF · COMPLIANCE & SECURITY
SOC 2 in 90 Days: The Accelerated Compliance Playbook for PE Portfolios
Stop the 12-month compliance drag. Learn how PE operating partners use automation to achieve SOC 2 readiness in 90 days, reducing costs by 60% and unblocking enterprise deals.
54 Days Added to Sales Cycles w/o SOC 2

BRIEF · COMPLIANCE & SECURITY
SOC 2 Type I vs. Type II: Which One Do PE Buyers Actually Require?
Type I proves control design; Type II proves operating evidence. See how PE buyers evaluate SOC 2 readiness before LOI and during diligence.
Type II Stronger Buyer Signal
BRIEF · PROCESS DOCUMENTATION
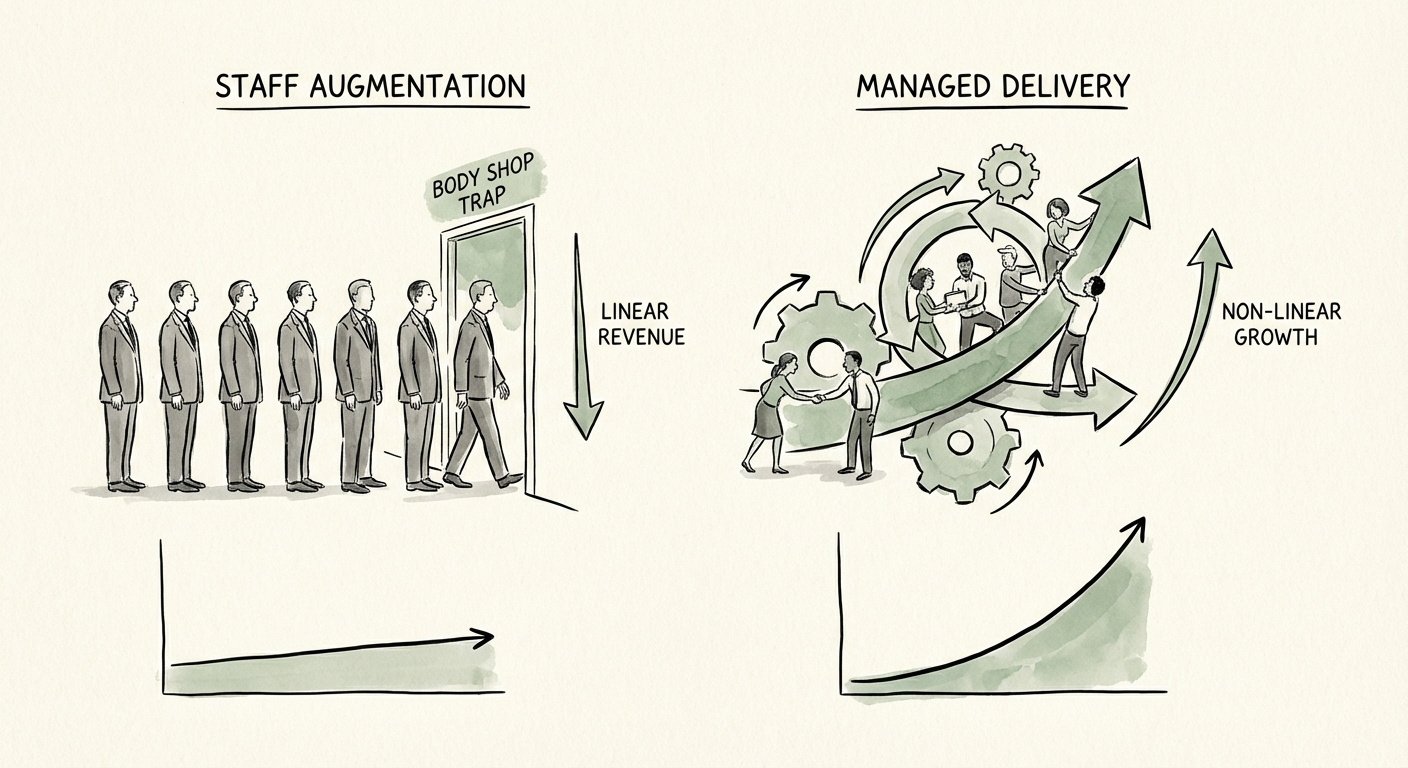
Staff Augmentation vs. Managed Delivery: The 'Body Shop' Trap That Kills Valuation
Data shows Staff Augmentation firms trade at 0.6x revenue, while Managed Delivery firms command 2x+. Here is the diagnostic to determine which model scales.
3x Valuation Multiple Gap
BRIEF · EXIT READINESS
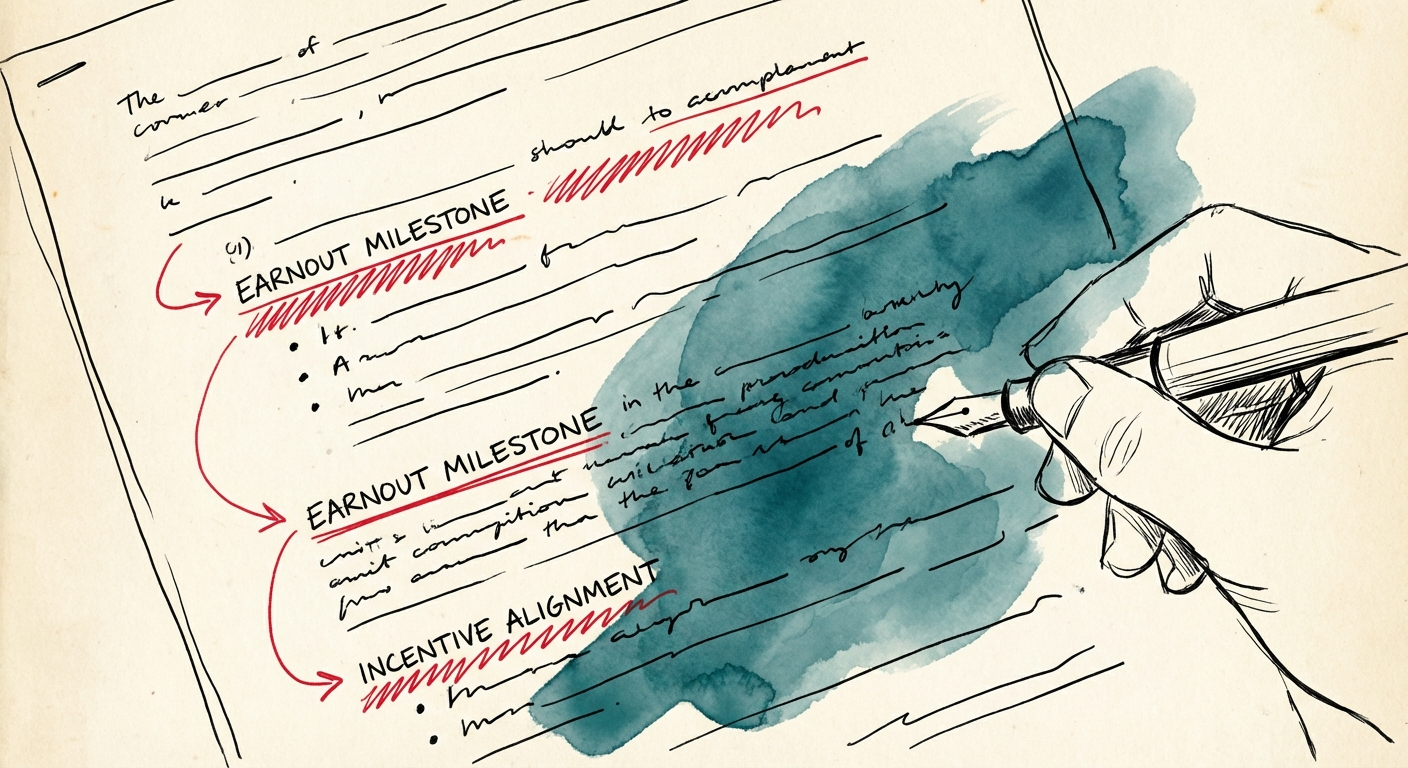
Earnouts That Actually Pay Out: Structuring Incentives That Align
Earnouts average just 21 cents on the dollar. Here is the operator's guide to structuring earnout milestones that actually pay out upon exit.
$0.21 Avg. Payout per Earnout Dollar
BRIEF · FINANCIAL INFRASTRUCTURE
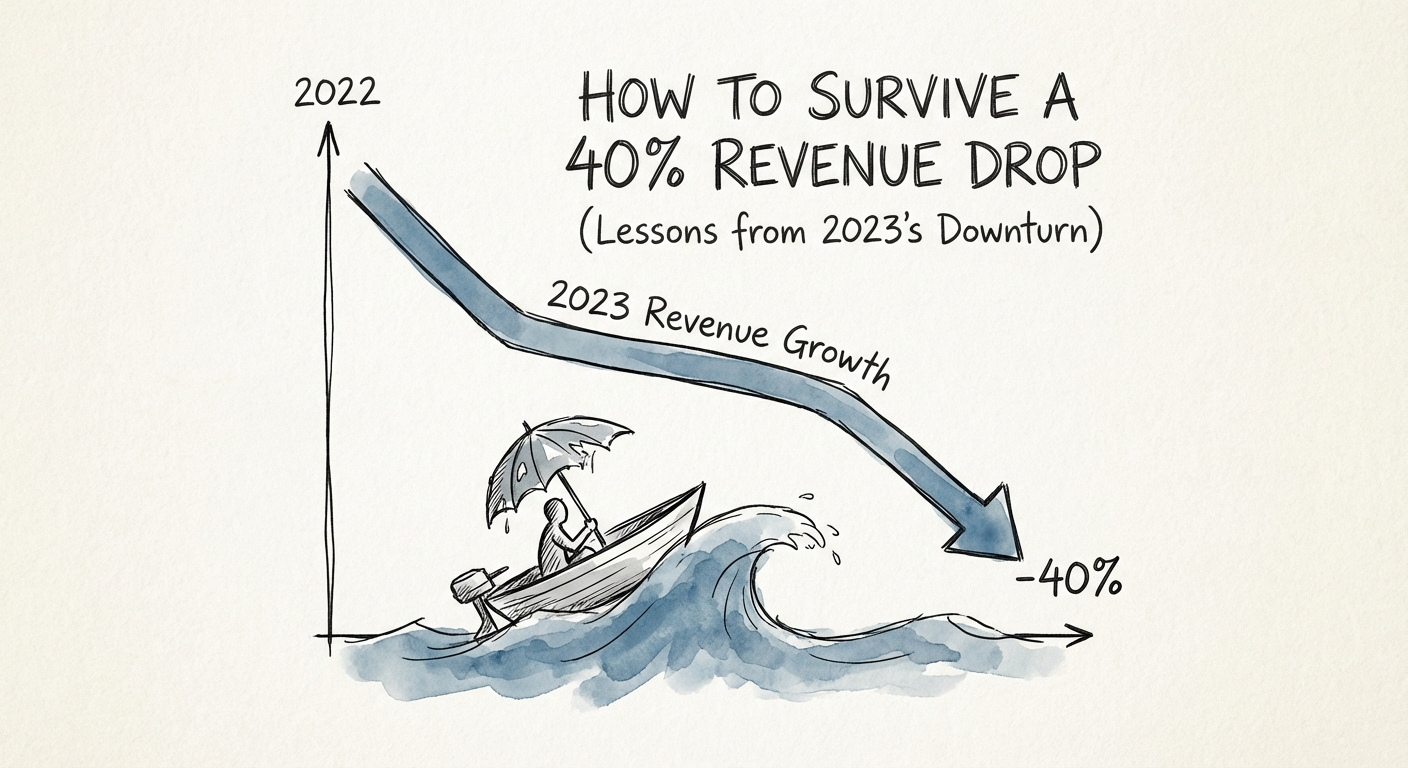
How to Survive a 40% Revenue Drop (Without Killing the Company)
Median SaaS growth plunged from 60% to 8.4% in 18 months. Here is the operator's playbook for surviving a revenue collapse, extending runway, and avoiding the 'death spiral' of down rounds.
8.4% Median SaaS Growth Rate (Sept 2023)