BRIEF · FOUNDER EXTRACTION
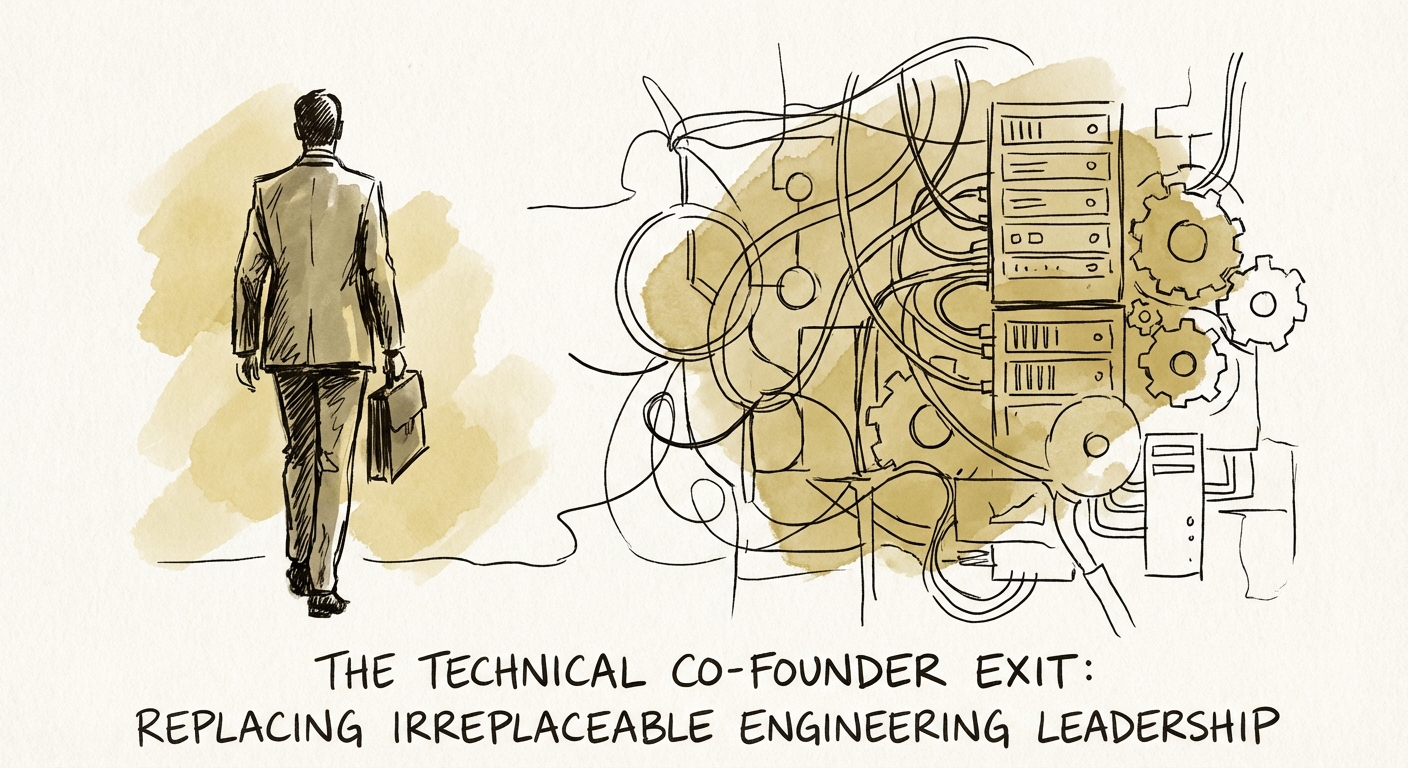
The Technical Co-Founder Exit: Replacing "Irreplaceable" Engineering Leadership
Technical founder exits trigger a 15-25% valuation discount. Learn the operator's playbook for replacing 'irreplaceable' CTOs without breaking the code or the business.
25% Valuation Discount Risk
BRIEF · TECHNICAL DEBT
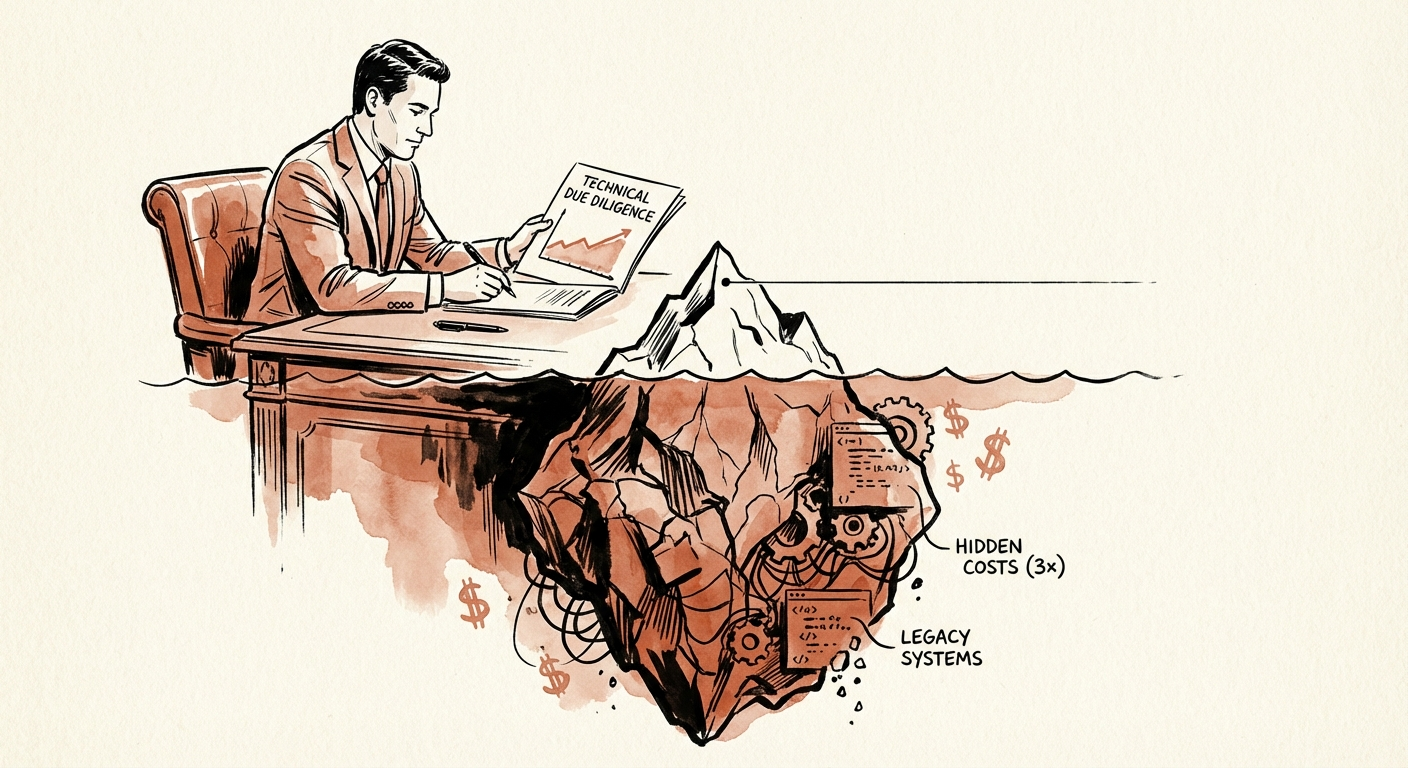
Why Your Technical Debt Estimate Is Probably 3x Too Low
New data from McKinsey and Gartner shows technical debt consumes 40% of IT budgets. Learn why standard due diligence misses the mark and how to price the real liability.
40% of IT Budget Consumed by Tech Debt
BRIEF · TECHNICAL DEBT
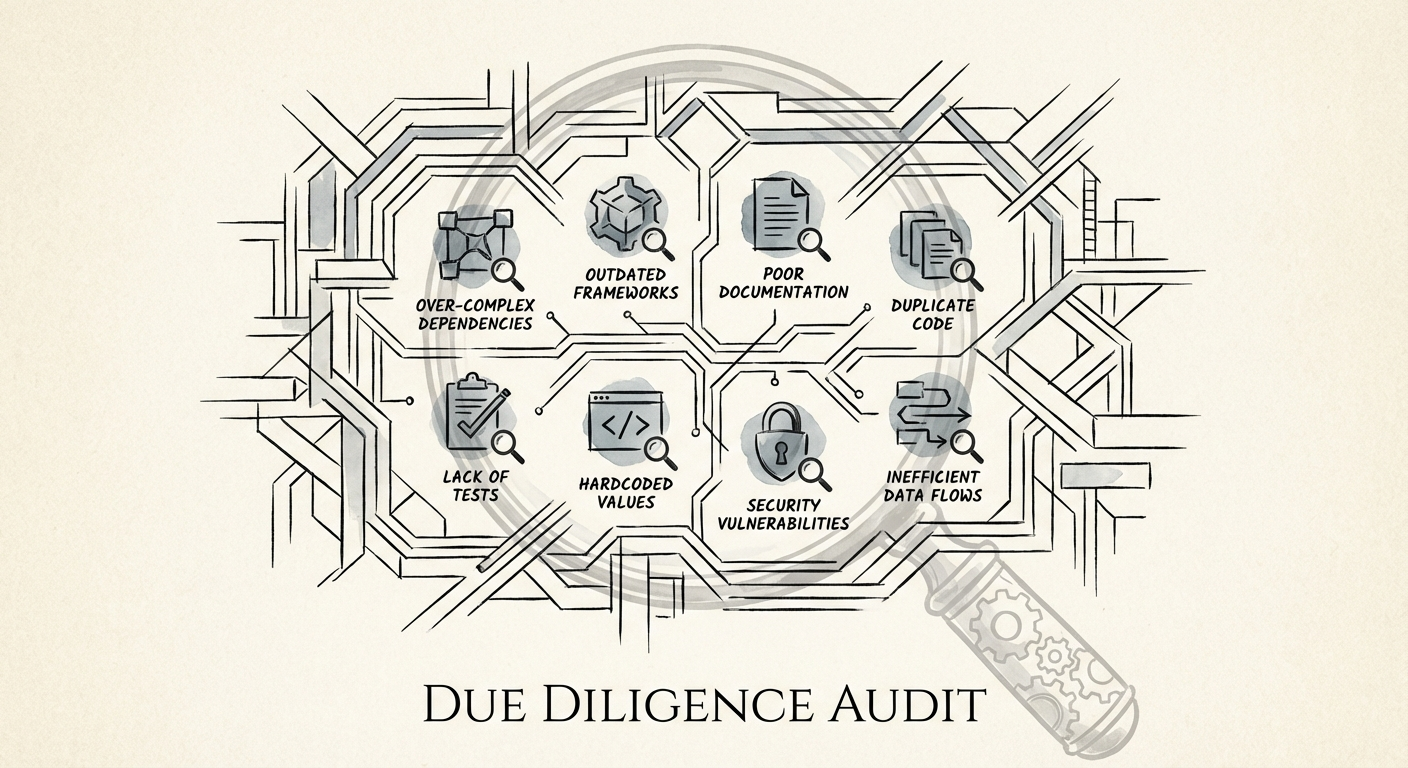
8 Technical Debt Indicators That Show Up in Code Audits
Stop buying broken code. Discover the 8 specific technical debt indicators that kill deal value, backed by 2025 M&A benchmarks and remediation cost data.
30x Higher Cost to Fix Defects in Production
BRIEF · TECHNICAL DEBT
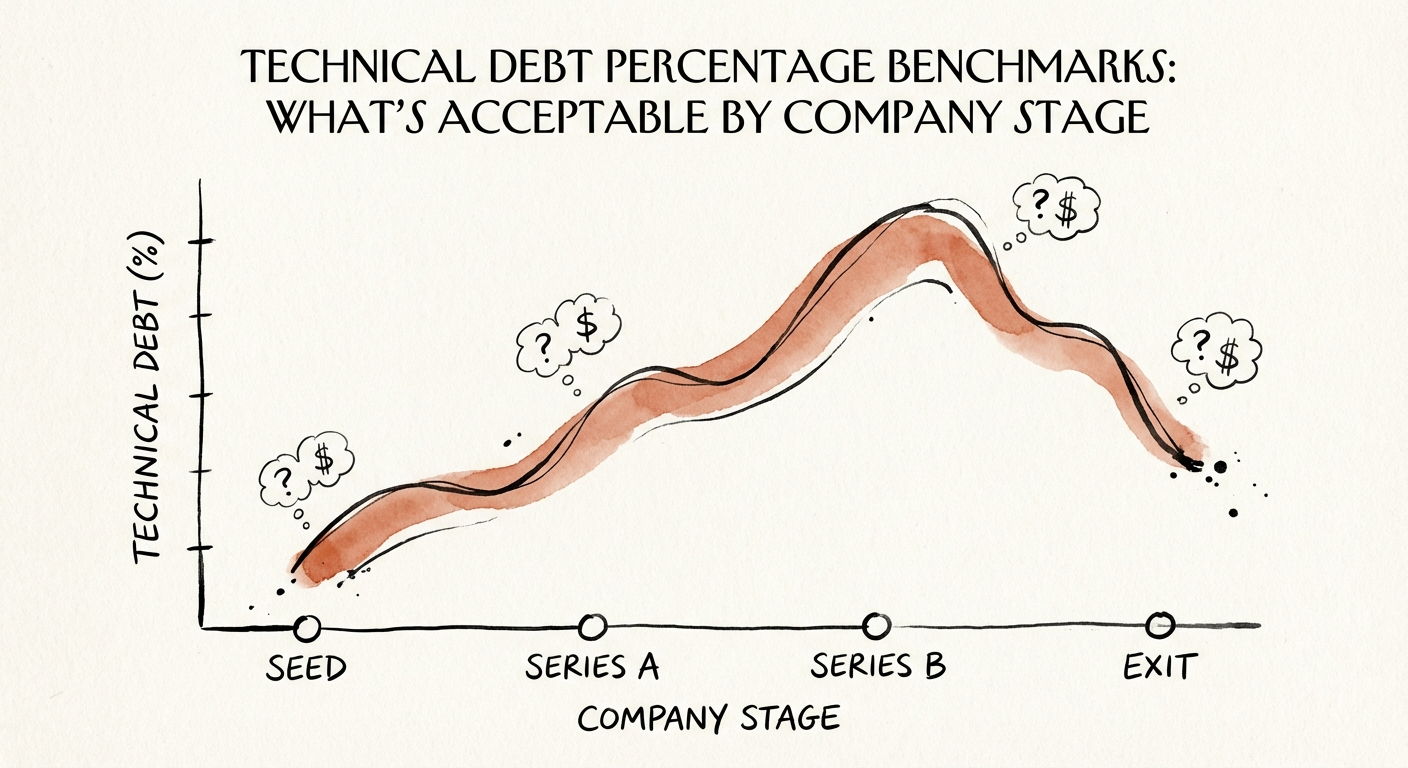
Technical Debt Percentage Benchmarks: What's Acceptable by Company Stage
Benchmarks for technical debt allocation by Series A, B, and C. Research from McKinsey and Stripe reveals 33% of dev time is lost to debt. Here is the acceptable threshold.
33% Developer Time Lost to Debt
BRIEF · TECHNICAL DEBT
Putting a Dollar Sign on Tech Debt: How to Price Code Quality in a Deal Model
Your QofE has a number for everything except the code. Here's how to convert technical debt into a hard dollar figure your IC memo can actually use.
33% Engineering Payroll Wasted
BRIEF · TECHNICAL DEBT
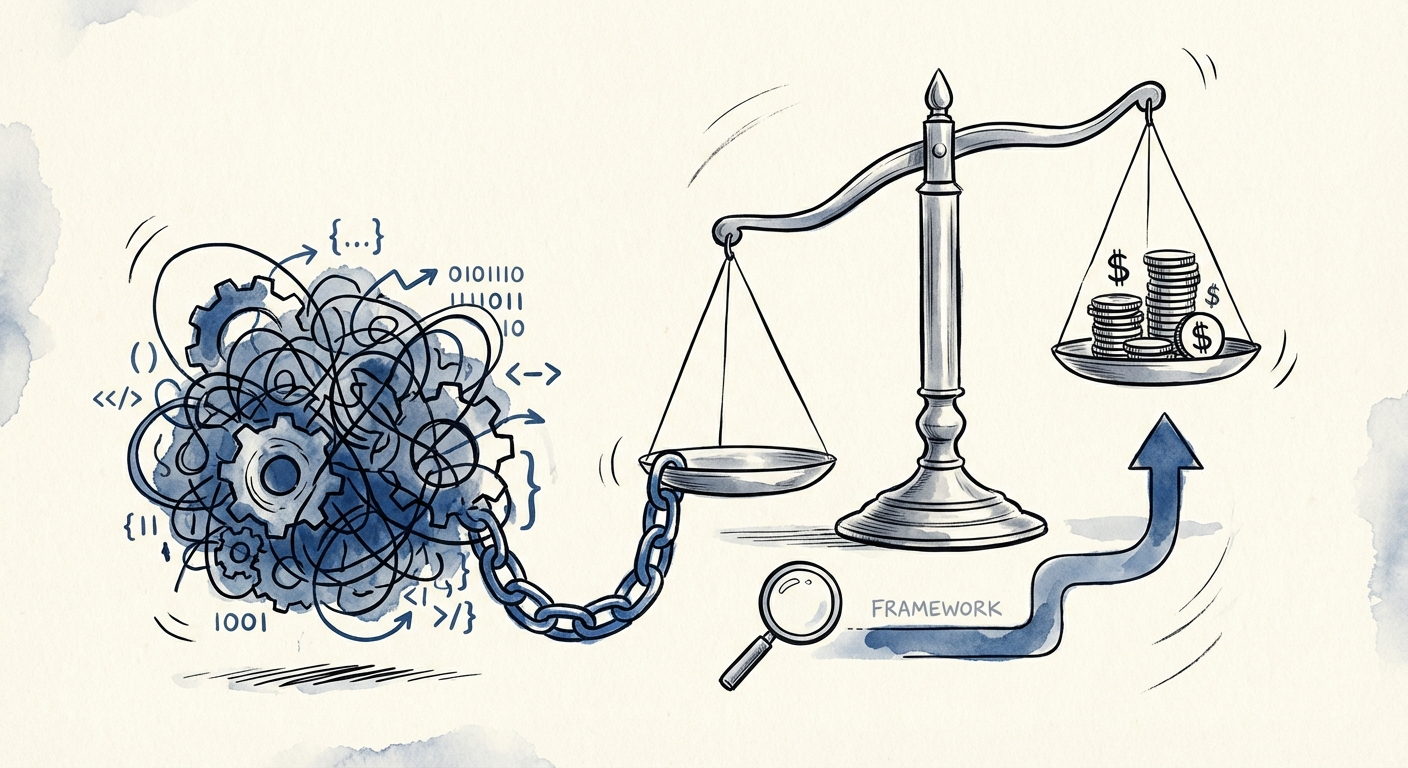
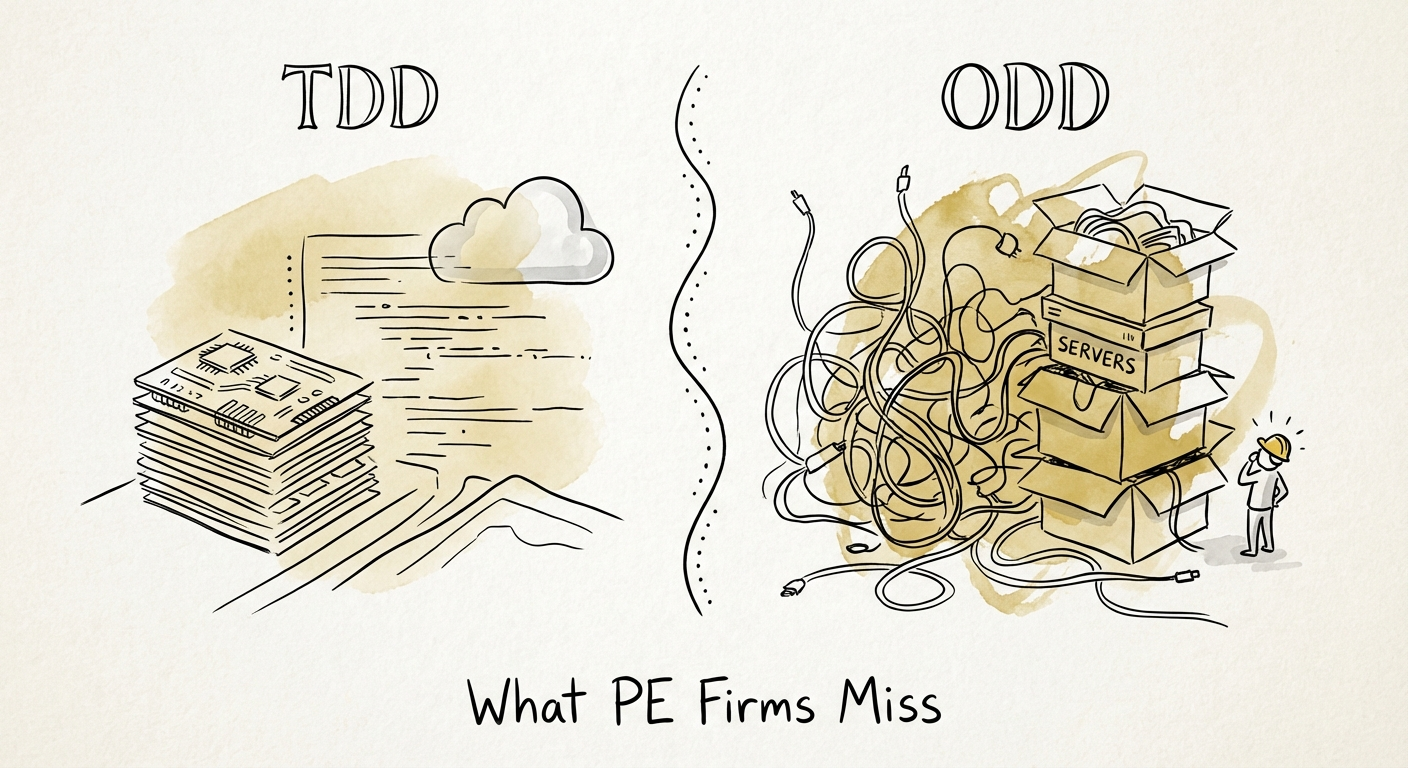
Technical Due Diligence vs. Operational Due Diligence: Why Clean Code Still Wrecks the Deal
Your TDD report said the code was clean. It didn't say one engineer holds the deploy keys. Here's what operational diligence catches that technical diligence can't.
40% Hidden Tech Estate Debt
BRIEF · TEAM & HIRING
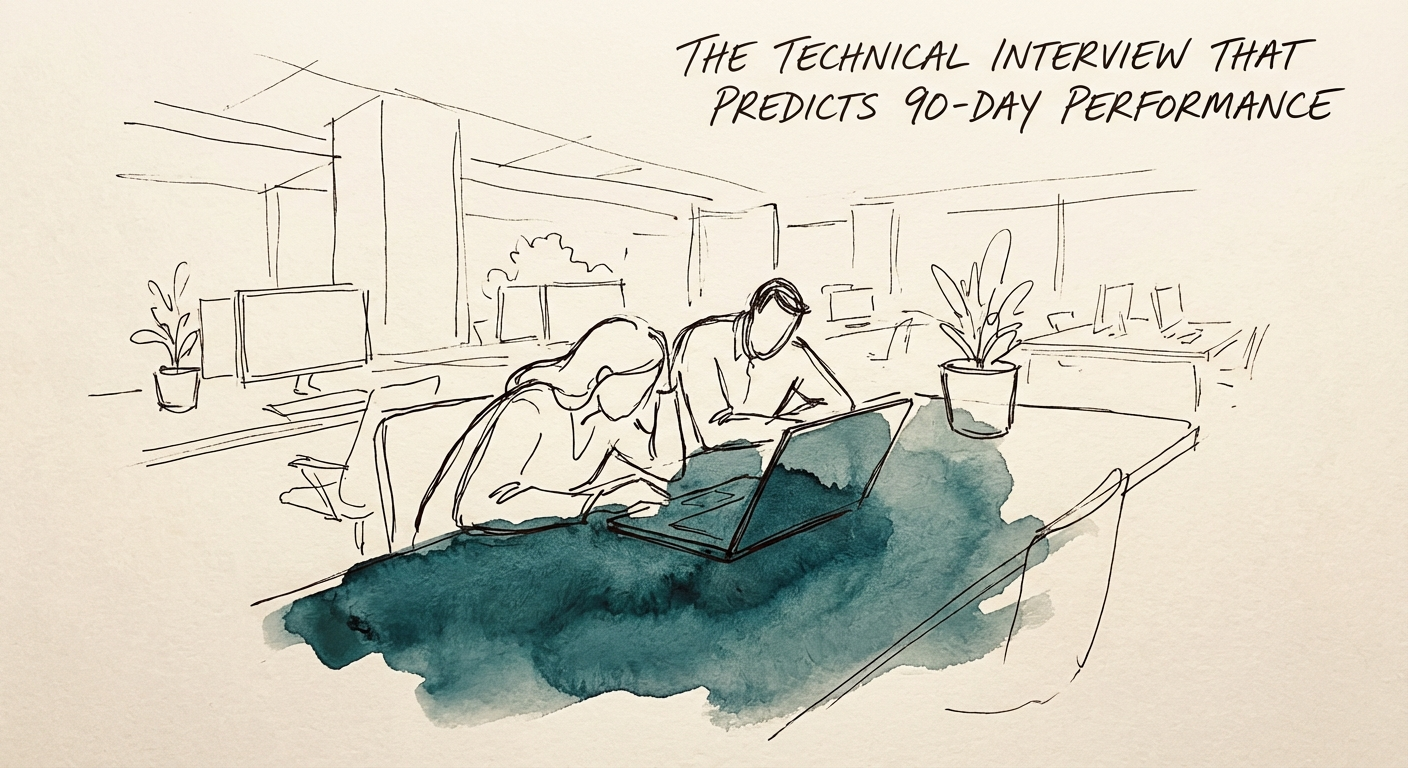
The Technical Interview That Predicts 90-Day Performance
Stop hiring LeetCode experts who can't ship. Learn the "90-Day Simulation" interview method that predicts actual engineering performance.
46% New Hire Failure Rate
BRIEF · TECHNICAL DEBT
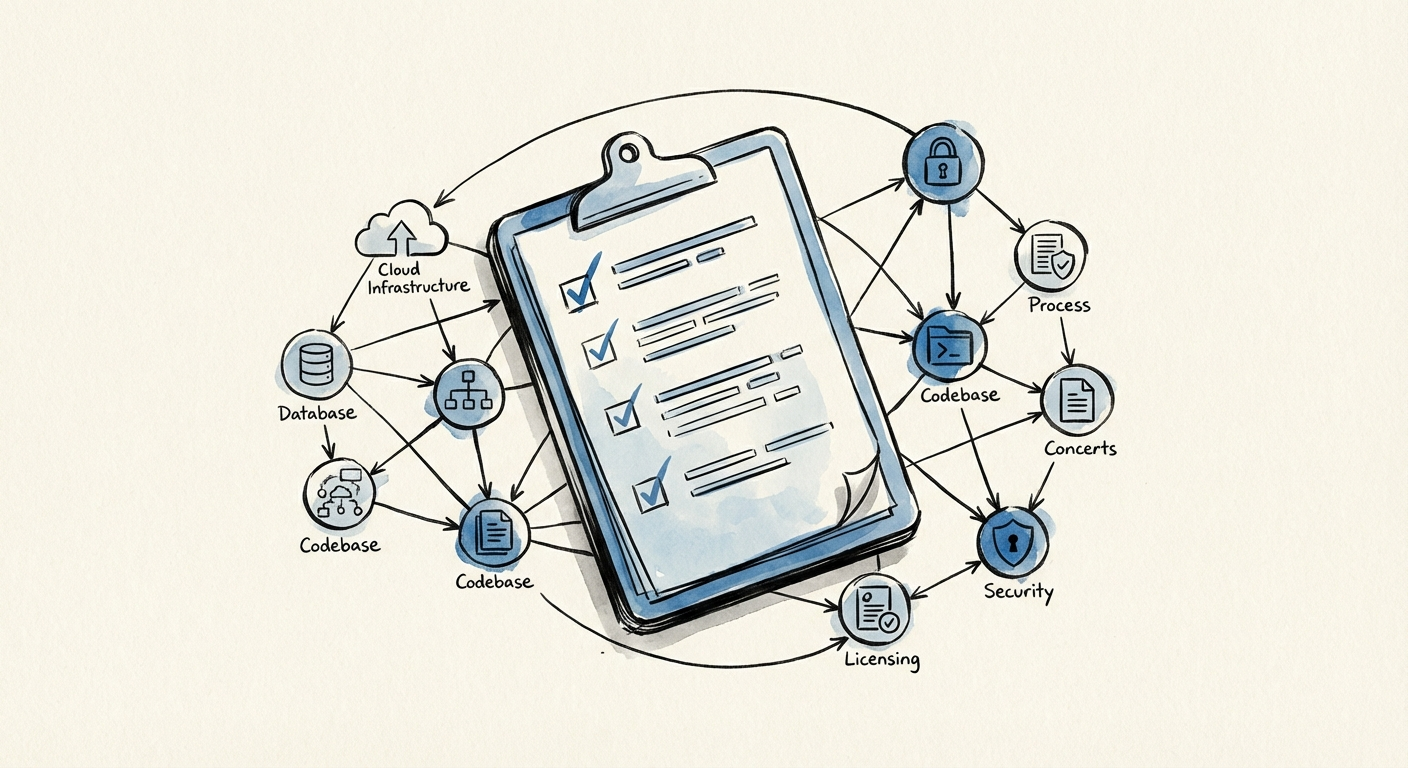
Technology Due Diligence for Software Acquisitions: The Checklist That Survives Re-Trade
A CIO interview won't tell you whether you actually own the code. The technical diligence checklist for software deals that turns findings into purchase-price adjustments.
74% High-Risk Vulnerabilities
BRIEF · TECHNICAL DEBT
10 Red Flags in Technology Due Diligence That Kill Deals
Tech due diligence isn't a checkbox—it's a valuation lever. Discover the 10 red flags that kill deals, from 74% high-risk vulnerabilities to the 'Hero Developer' trap.
74% High-Risk Vulnerabilities
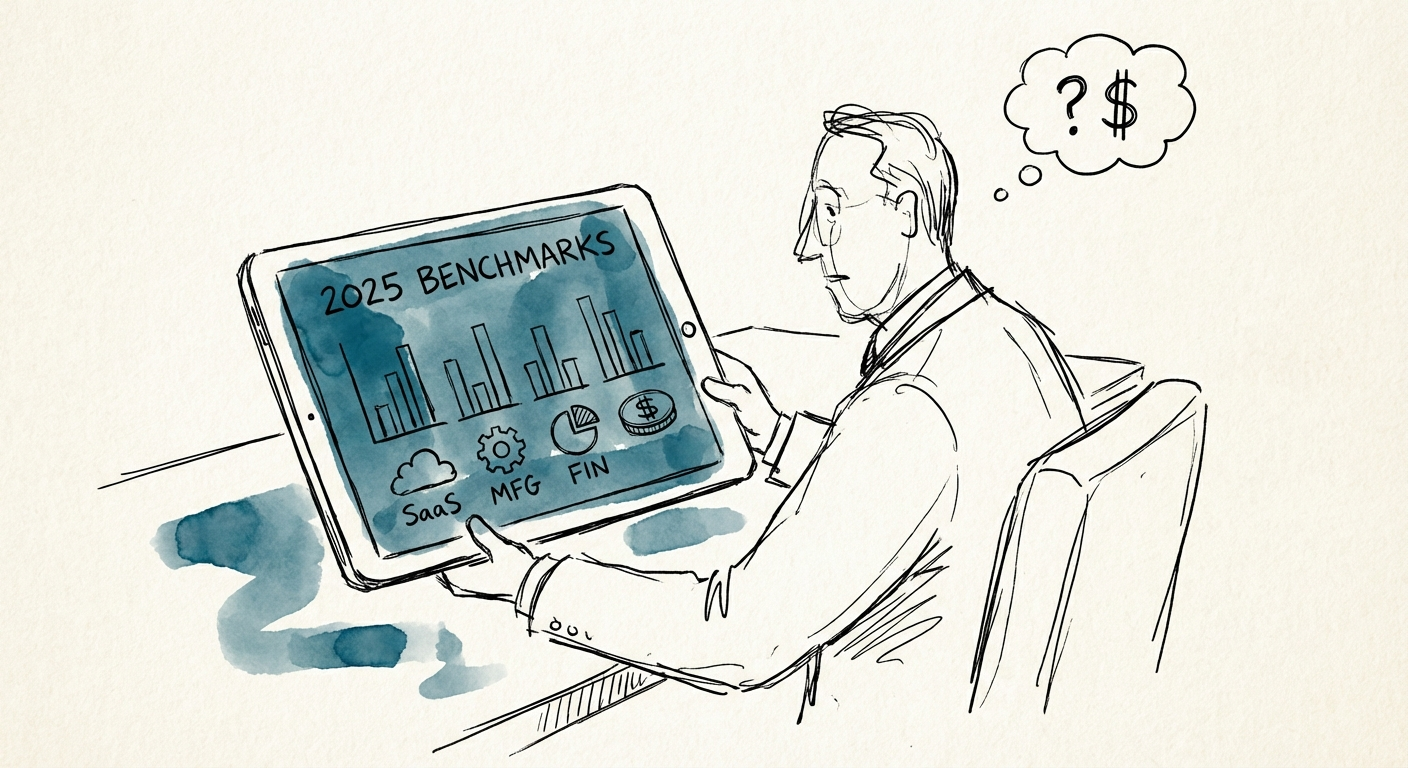
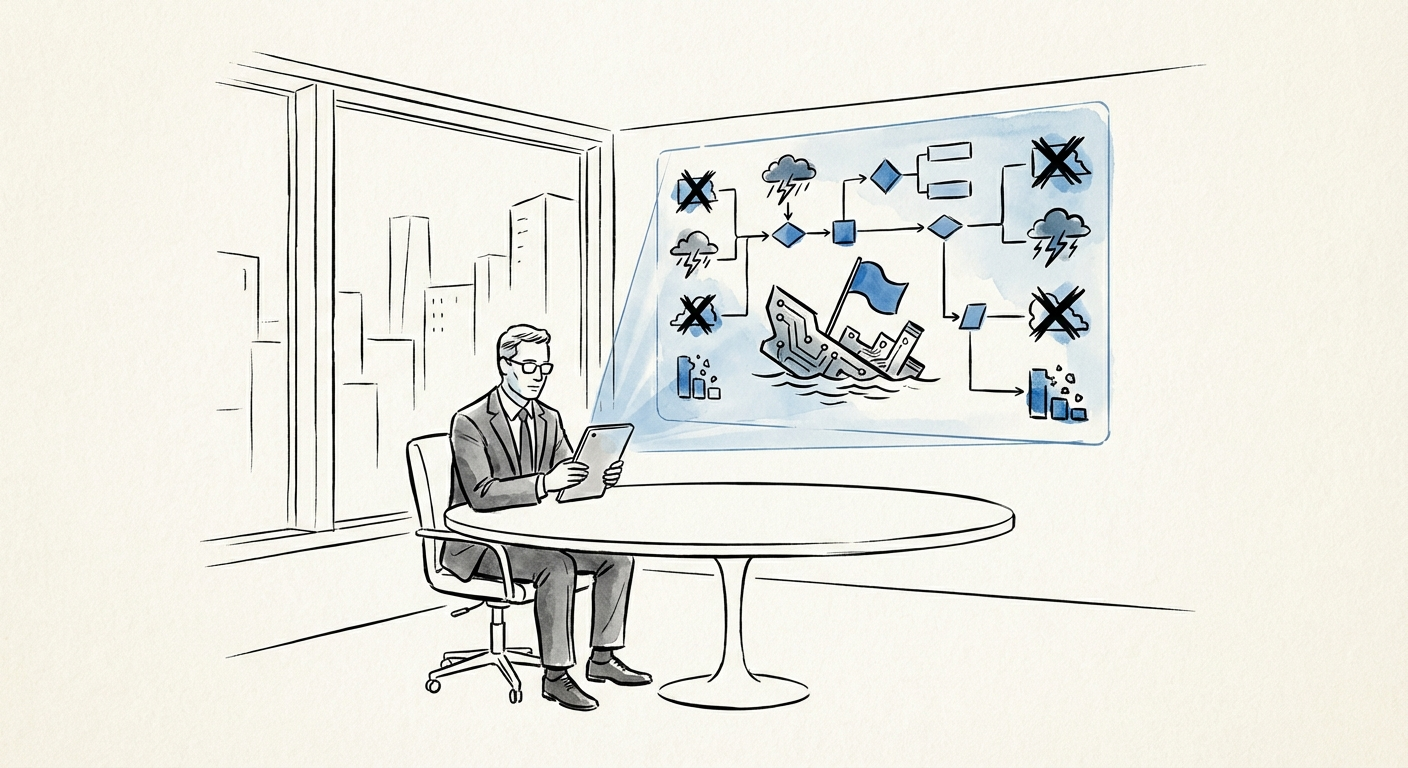
BRIEF · FINANCIAL INFRASTRUCTURE
The Black Box of IT Spend: 2025 Benchmarks for Private Equity
2025 IT spend benchmarks for PE portfolio companies. Why average spending (3.6%) is a misleading metric and how to shift budget from maintenance to innovation.
56% of IT Budget Consumed by Maintenance (Deloitte)
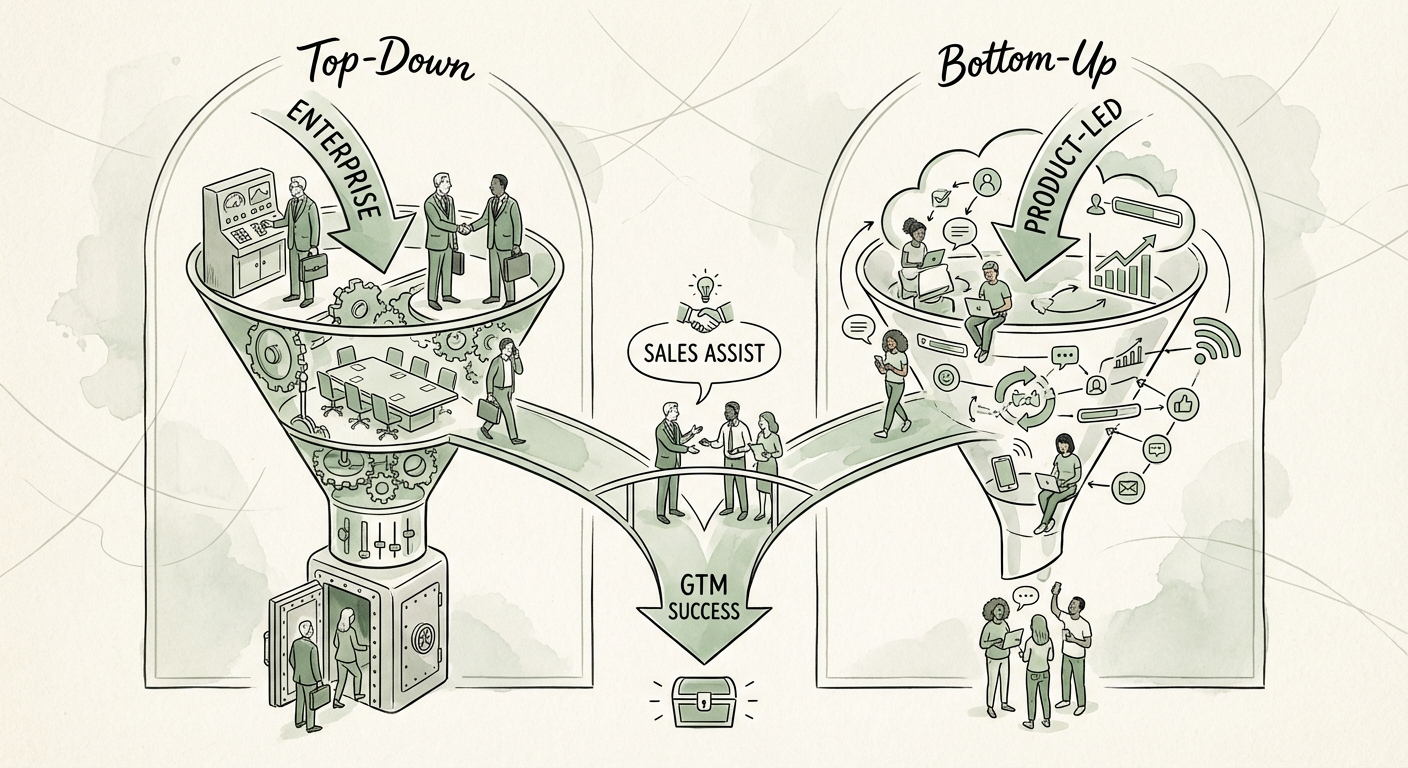
BRIEF · GTM EXECUTION
Top-Down vs. Bottom-Up Sales Motions: Choosing the Right GTM for B2B
Stop guessing your GTM strategy. New 2025 data shows Sales-Assisted PLG drives 3.5x higher ACV. Compare Top-Down vs. Bottom-Up benchmarks here.
3.5x Higher ACV with Sales-Assist
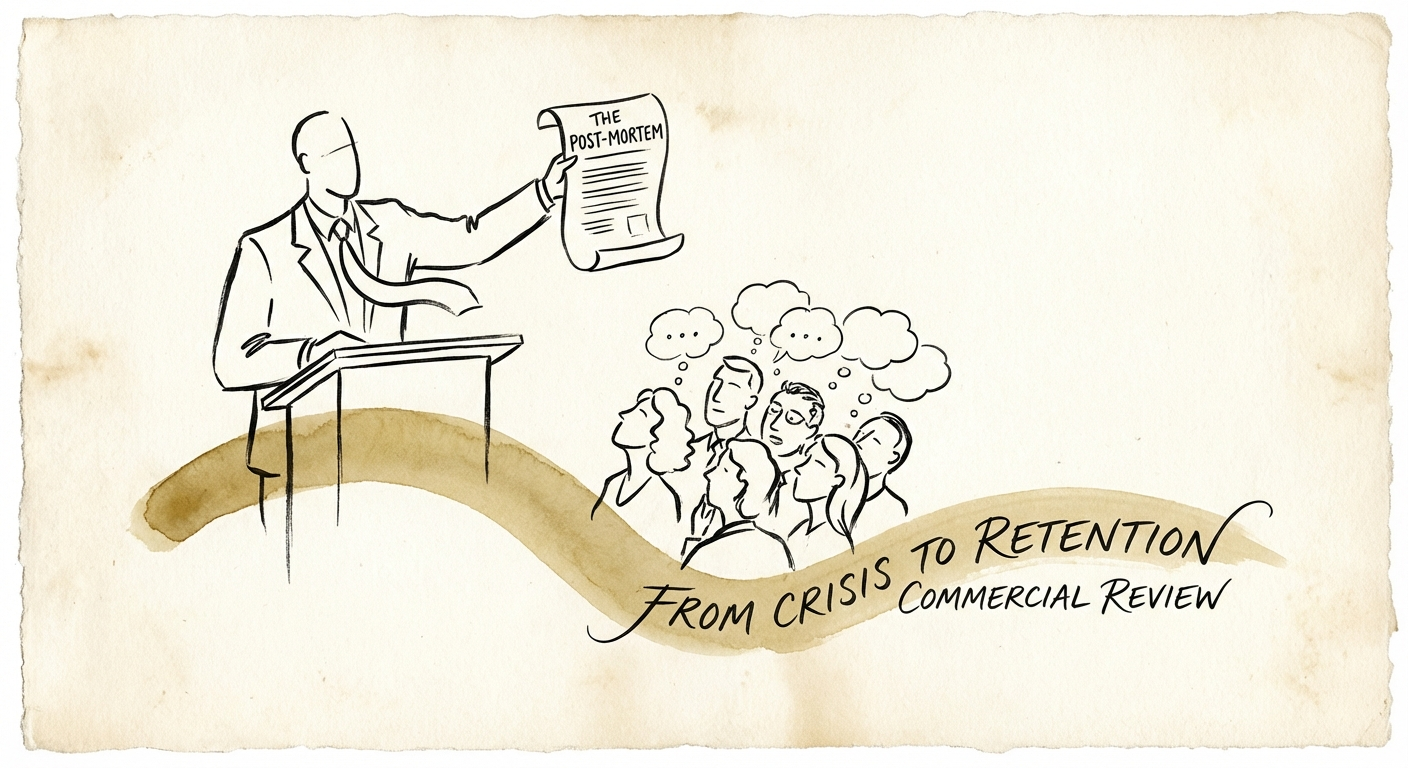
BRIEF · PROCESS DOCUMENTATION
The Post-Mortem That Saved the Account: Turning Delivery Failures into Retention
Don't hide your failures. Use the Service Recovery Paradox to turn angry clients into advocates. Data shows a 33% loyalty increase after resolved crises.
33% Increase in Client Loyalty
BRIEF · PROJECT RECOVERY
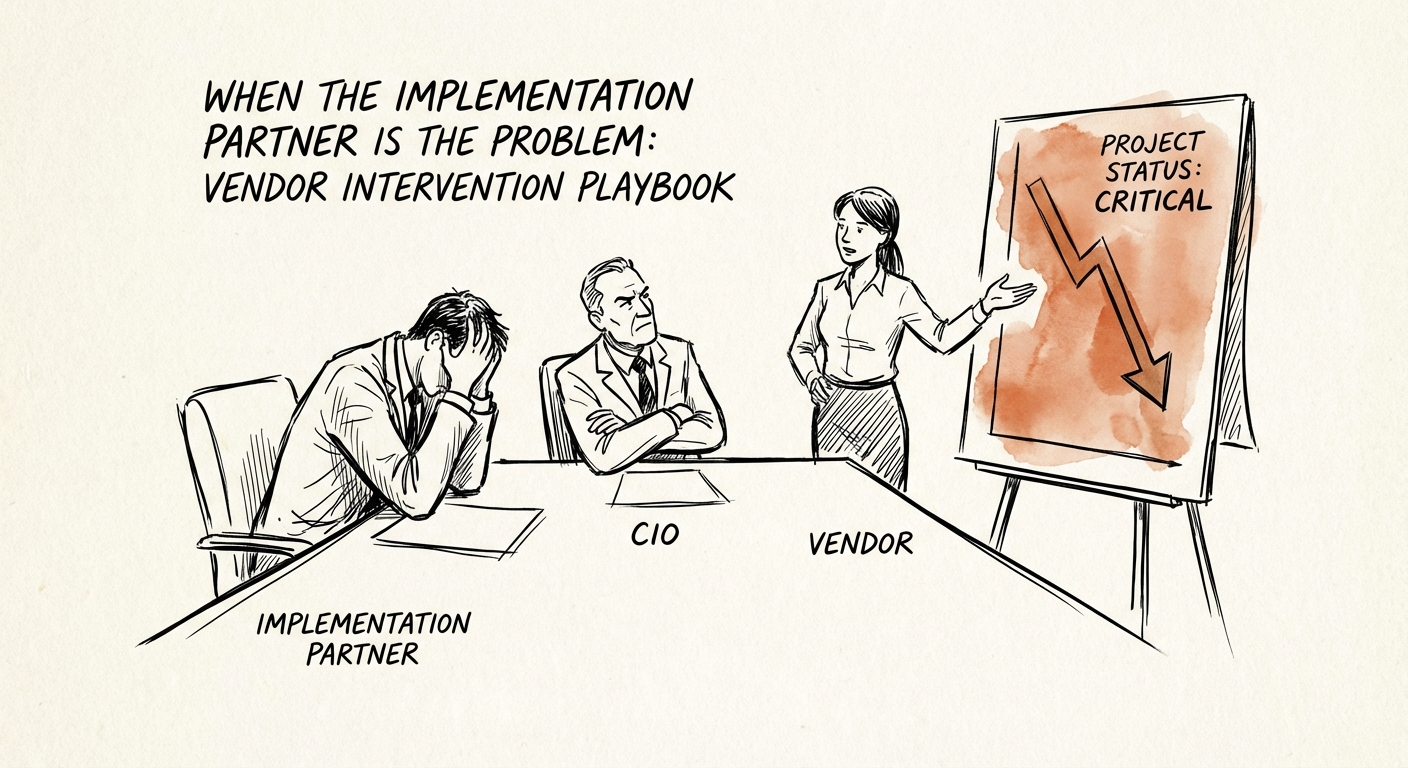
When the Implementation Partner Is the Problem: The Vendor Intervention Playbook
75% of ERP projects fail to meet objectives. Learn the Vendor Intervention Playbook to rescue stalled implementations, stop change order bleed, and hold SIs accountable.
189% Avg. Budget Overrun
BRIEF · TEAM & HIRING
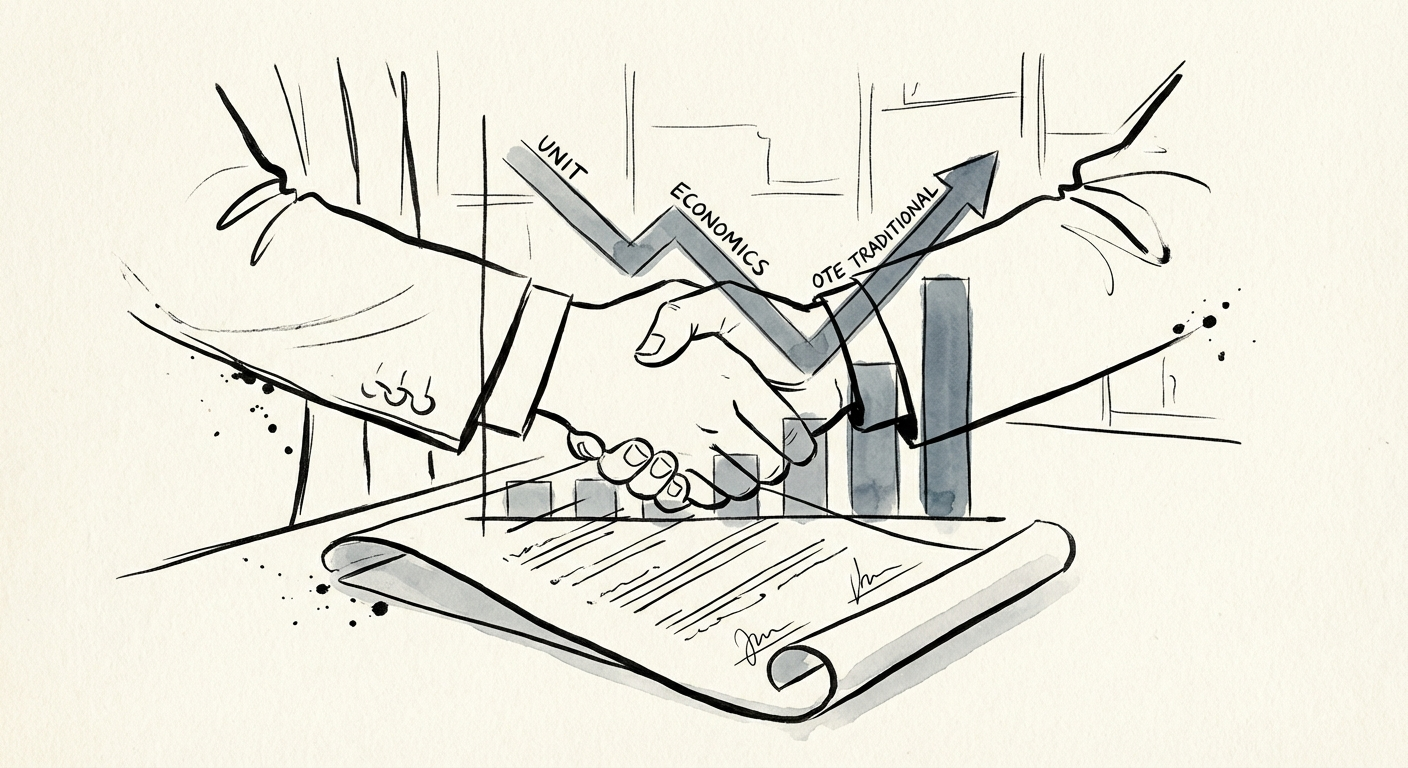
The VP of Sales Compensation Trap: Why Traditional OTE Kills Unit Economics
Stop paying for empty bookings. Here is the VP of Sales compensation framework that aligns incentives with EBITDA and Unit Economics. Benchmarks for Series B/C.
19 Months Avg. VP Sales Tenure
BRIEF · TEAM & HIRING
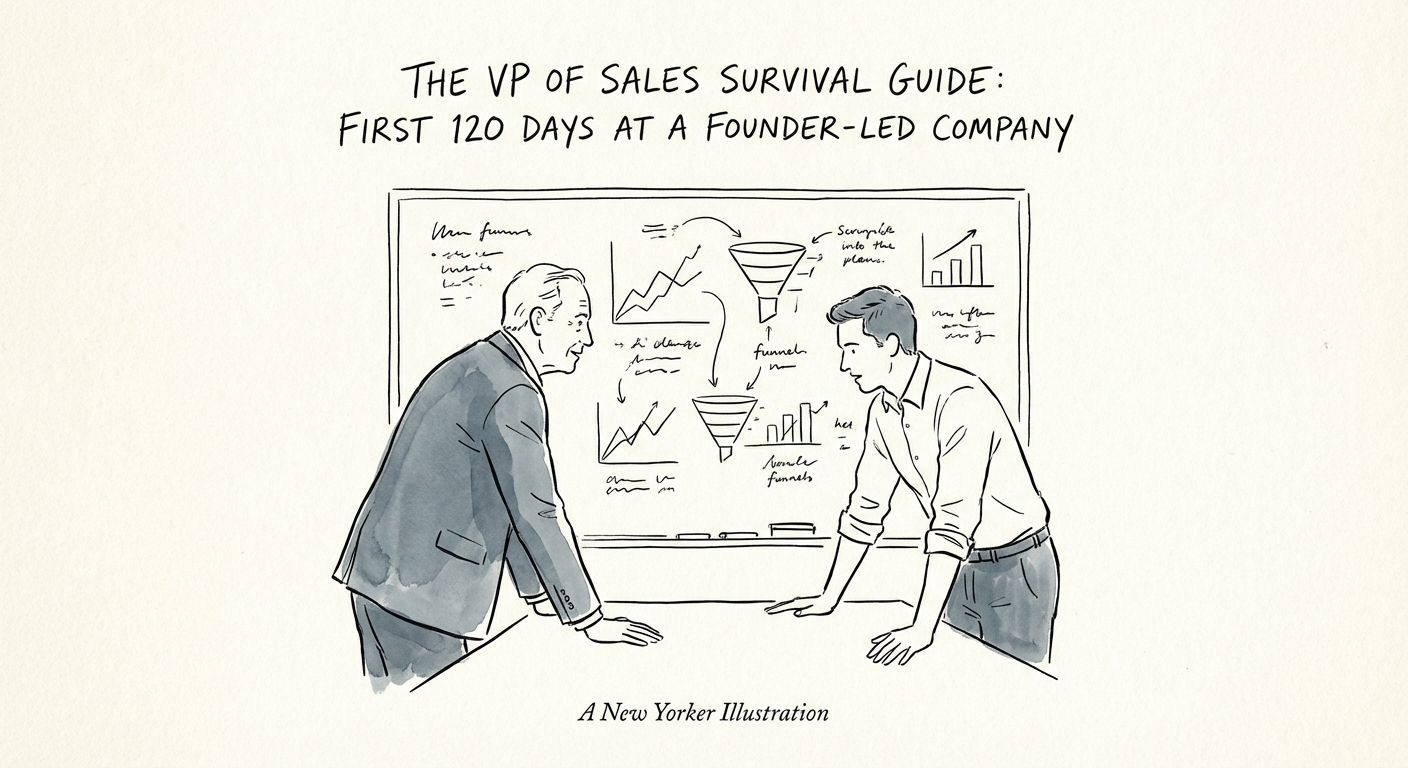
The First 120 Days of a VP of Sales at a Founder-Led Company (And Why Month One Should Have Zero Quota)
Your first VP of Sales hire keeps failing because you handed them an undocumented motion, not a system. Here is the 120-day extraction playbook that fixes it.
19 Months Avg. VP Sales Tenure
BRIEF · FINANCIAL INFRASTRUCTURE
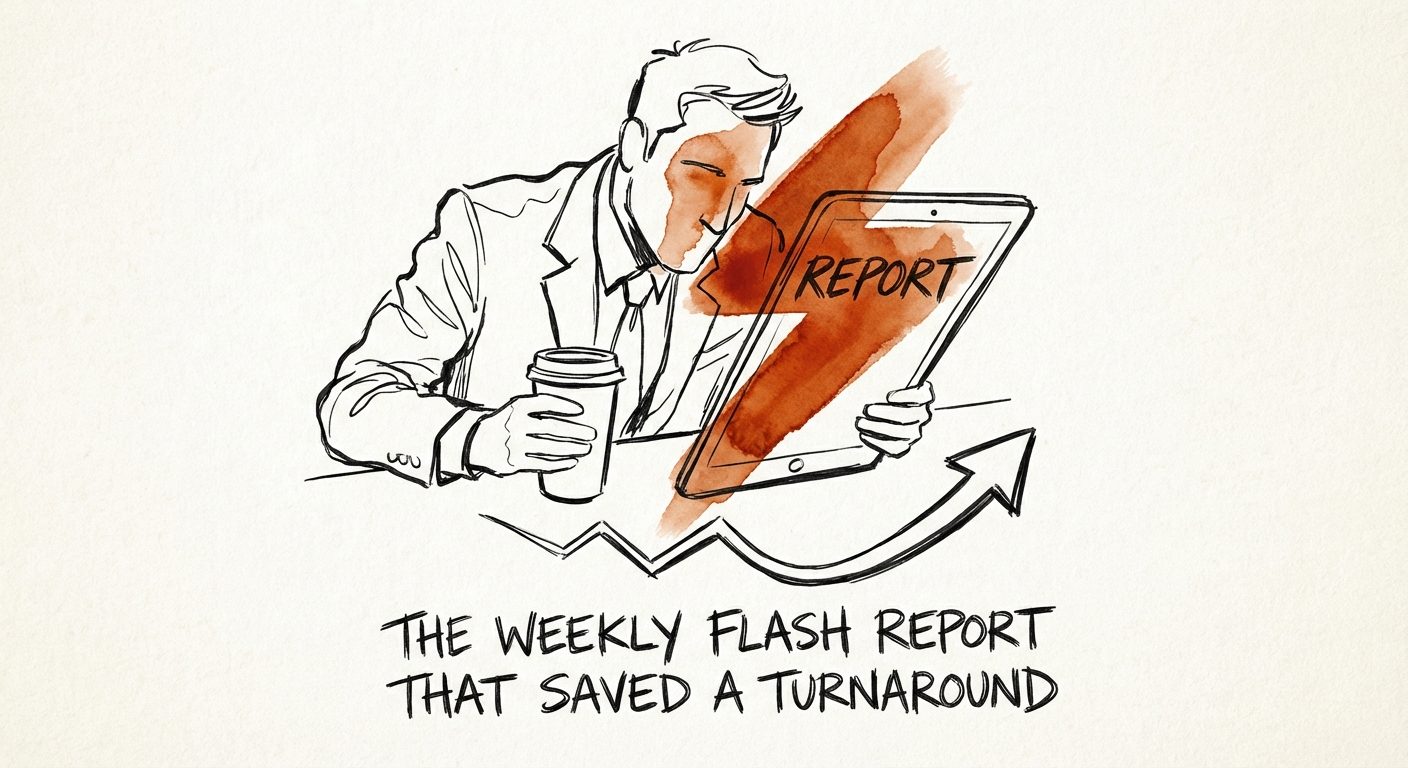
The Weekly Flash Report That Saved a Turnaround
Stop relying on 20-day-old board packs. Implement the Weekly Flash Report to fix cash visibility and drive operational turnarounds. Benchmarks included.
54% Value Creation from Ops
BRIEF · PROJECT RECOVERY
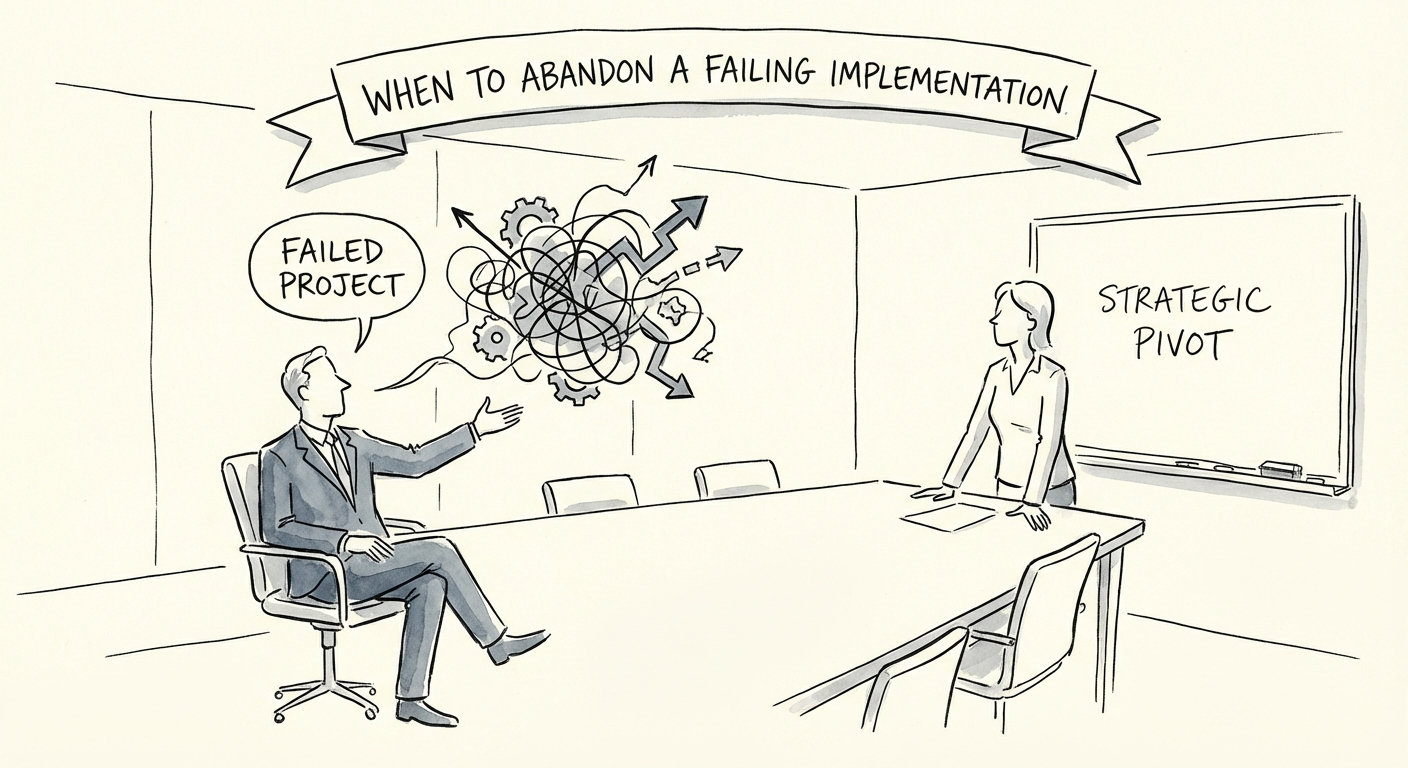
When to Kill a Failing Implementation: The Sunk Cost Exit Framework
Data shows some IT projects can put the company at risk. Learn the 3 specific exit signals that identify an unrecoverable project and the governance framework to exit gracefully.
30% GenAI Projects Abandoned by 2025
BRIEF · TEAM & HIRING
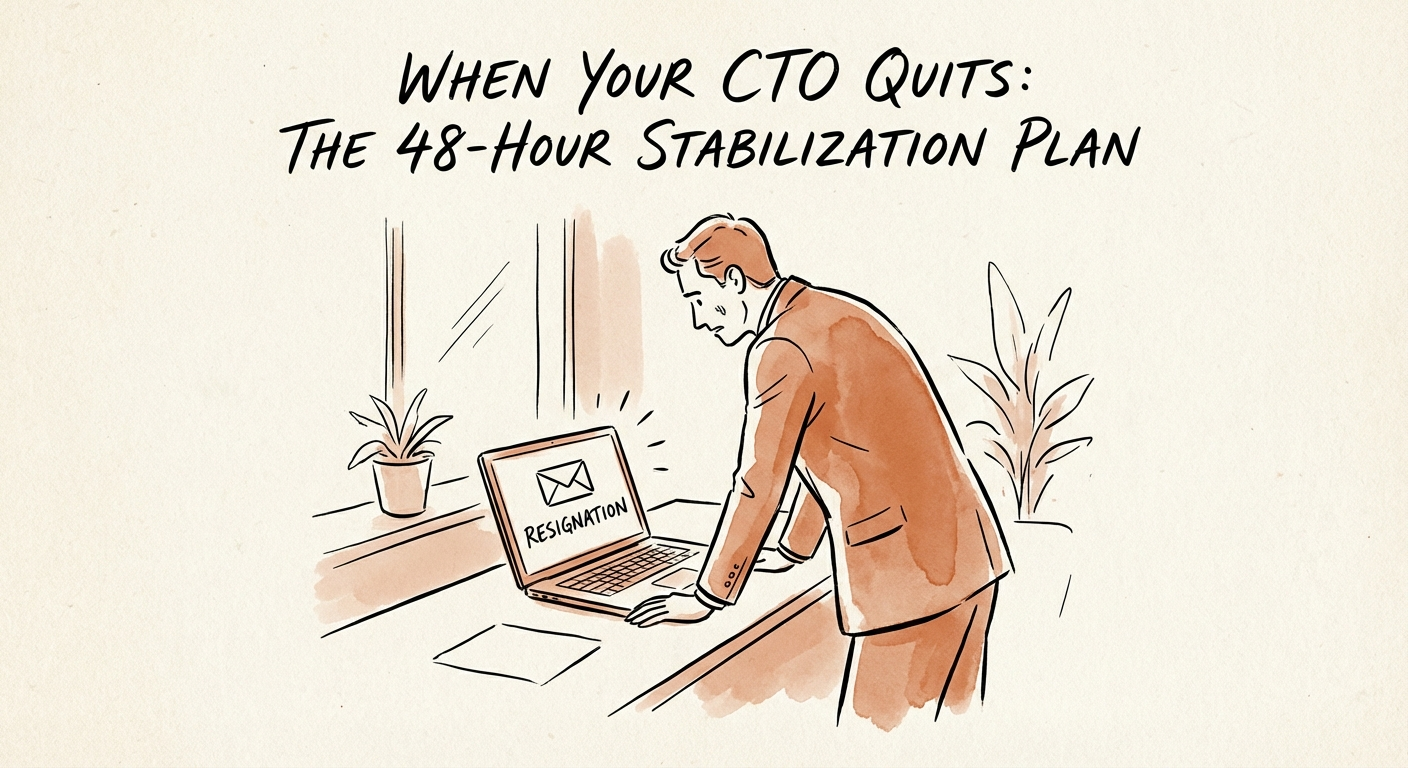
When Your CTO Quits: The 48-Hour Stabilization Plan
CTO turnover is 18%, higher than any other C-suite role. Here is the 48-hour crisis protocol to secure IP, stabilize engineering, and prevent a $1.2M mis-hire.
$1.2M Lost Opportunity Cost of a Bad Executive Hire
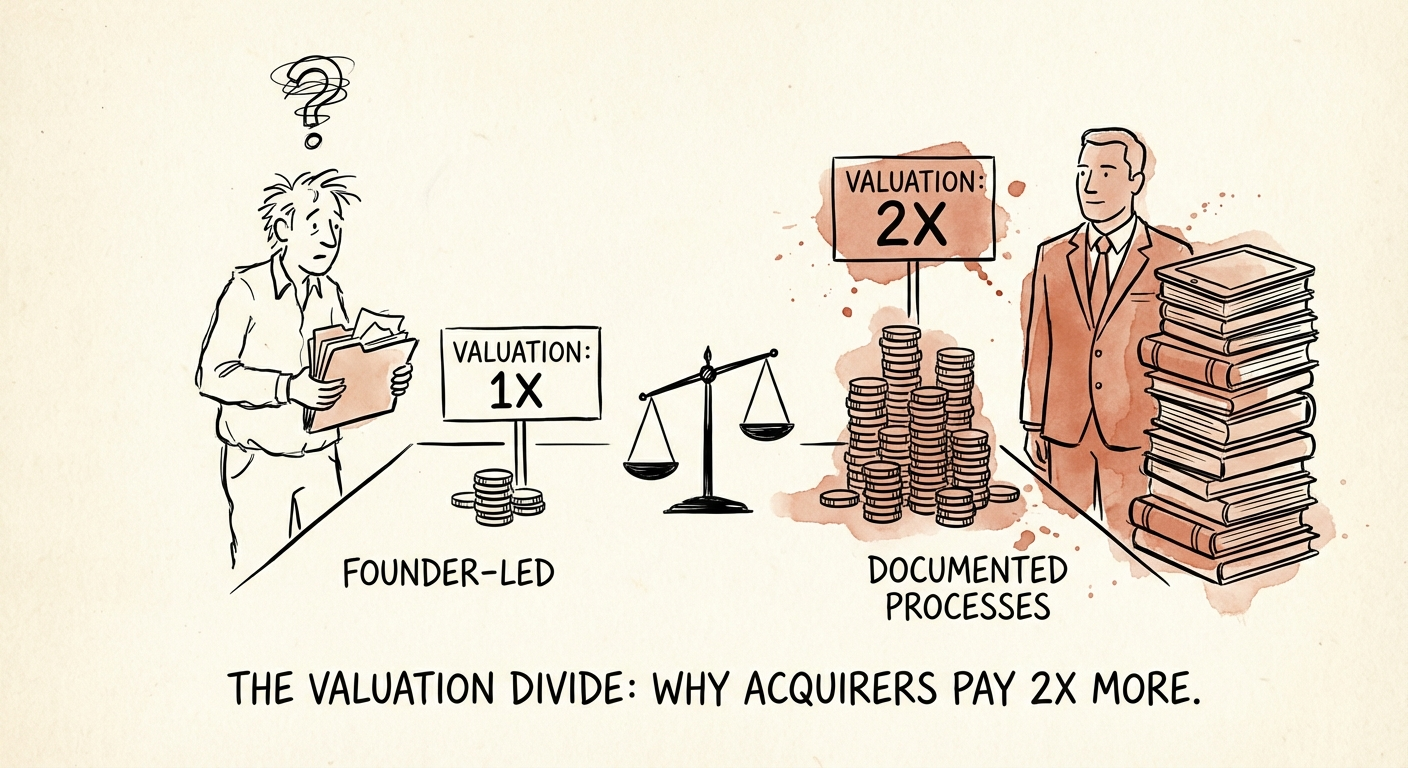
BRIEF · EXIT READINESS
The $5M Sentence: "Ask the Founder"
A data room full of "ask the founder" triggers a 25% Key Person Discount. Here's the documentation that moves a B2B tech firm from 4x EBITDA to 8x.
63% Higher Valuation Multiple
BRIEF · EXIT READINESS
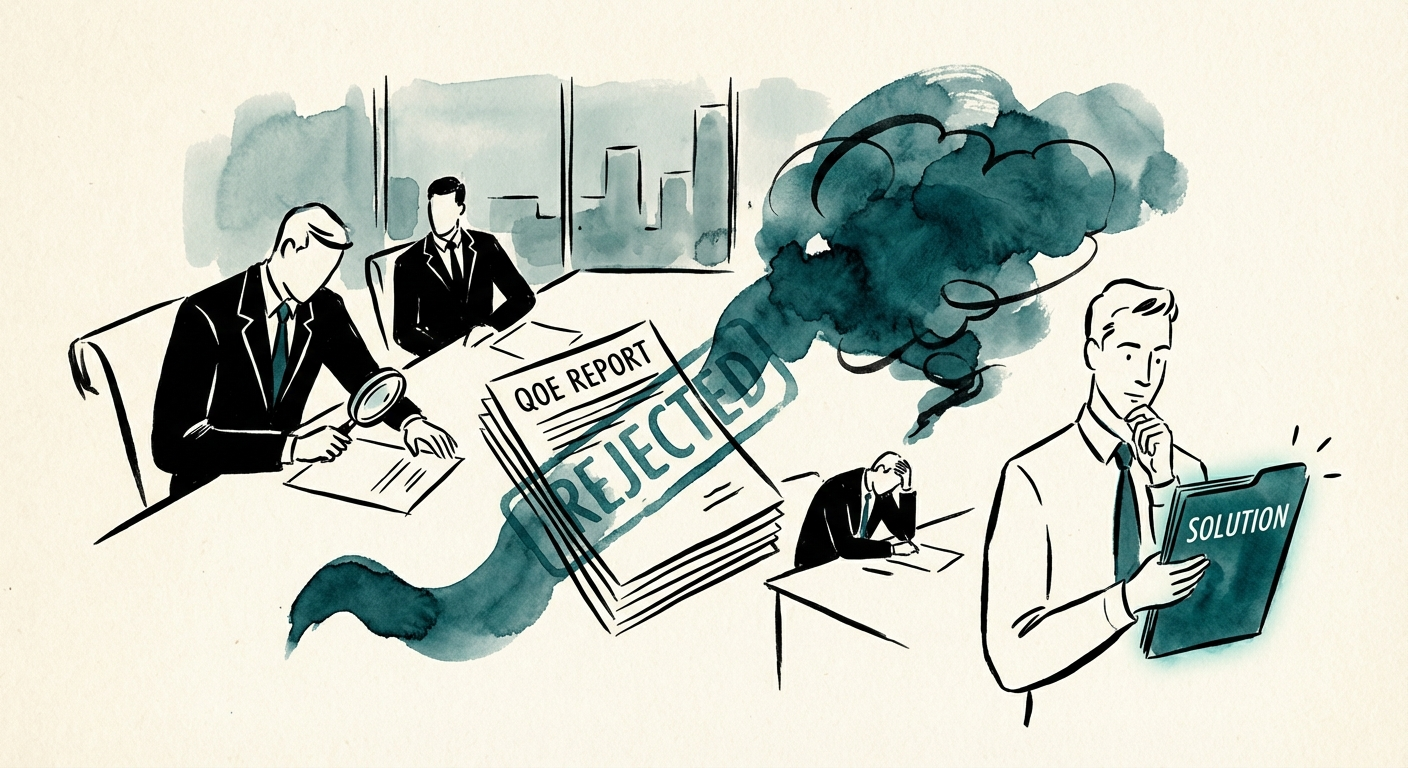
Why Your EBITDA Adjustments Will Get Rejected in Due Diligence (And How to Fix It)
Data from 2025 shows 70% of buyer PPA calculations are accepted over sellers'. Learn why EBITDA add-backs fail and how to protect your exit multiple.
70% Buyer PPA Win Rate

BRIEF · EXIT READINESS
The Founder's Dilemma: Why You Are the Wrong Person to Sell Your Company
Founders who sell their own companies risk leaving 20-50% of the deal value on the table. Here is the data-backed guide to hiring the right M&A advisor.
50% Valuation Premium
BRIEF · GTM EXECUTION
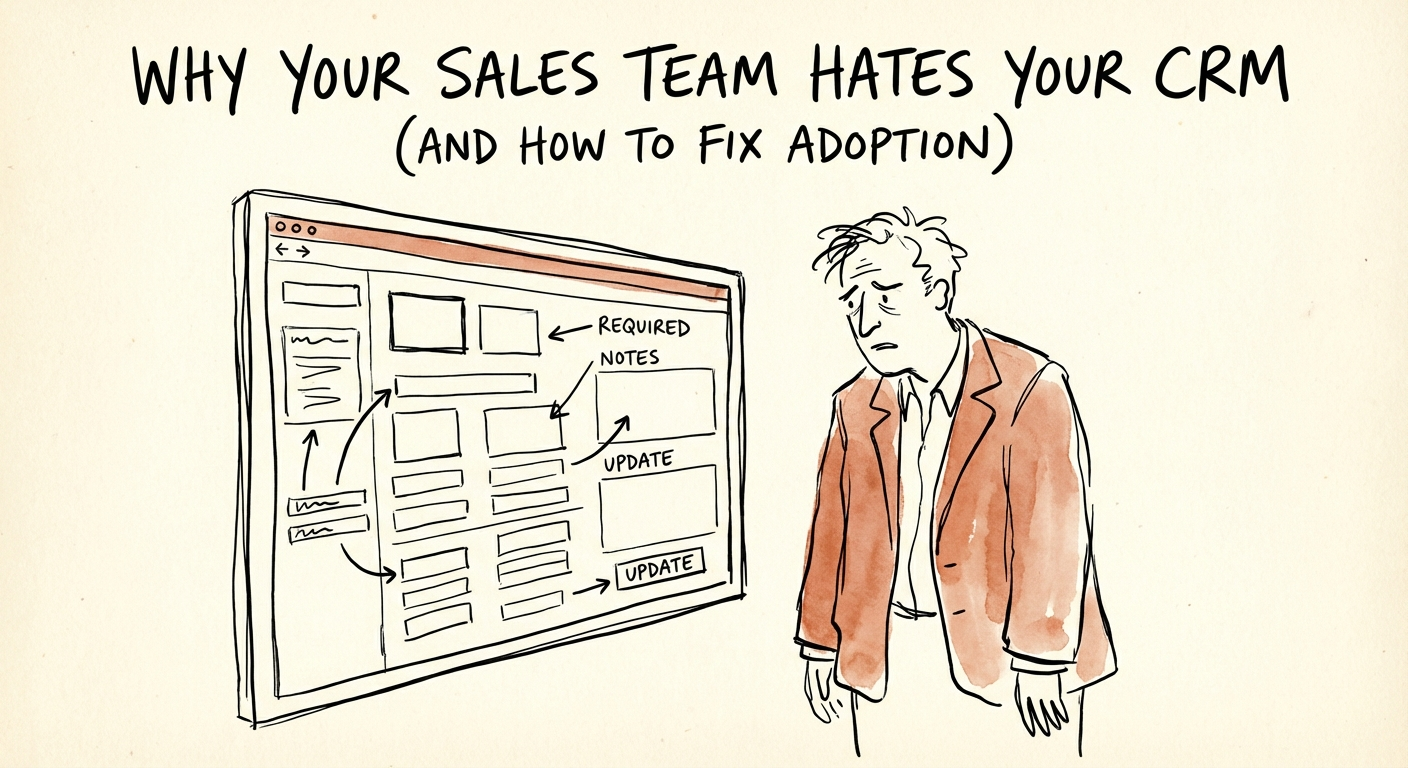
Why Your Sales Team Hates Your CRM (And How to Fix Adoption)
Sales reps spend 72% of their time on admin, not selling. Here is the diagnostic guide to fixing CRM adoption, reducing data friction, and ensuring your forecast isn't a work of fiction.
72% Time Spent NOT Selling
BRIEF · COMPLIANCE & SECURITY
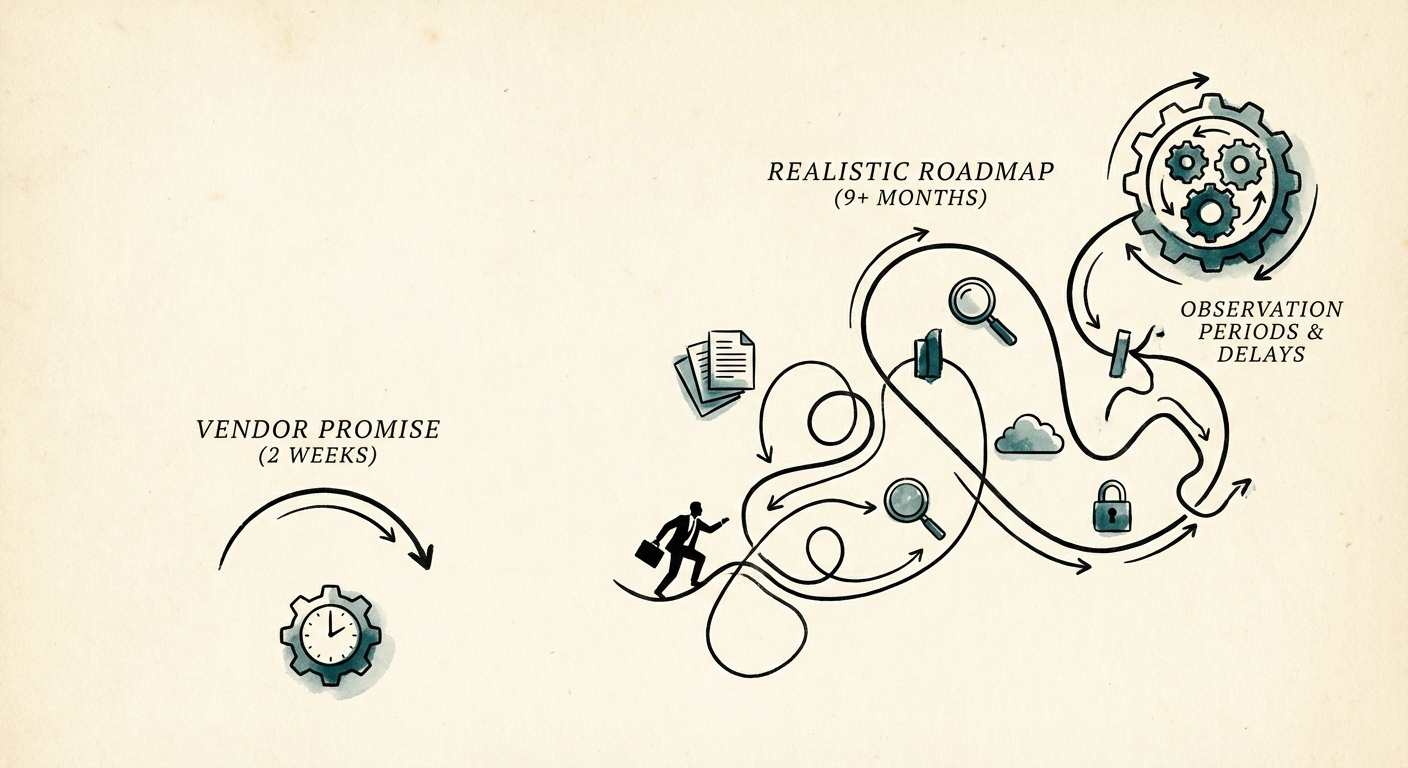
Why SOC 2 Compliance Takes Twice as Long as Vendors Promise
Automation tools promise SOC 2 in weeks. Reality check: Type 2 audits take 6-12 months. Here's where the time actually goes and how to fix it.
6-12 Months Real SOC 2 Type 2 Timeline
BRIEF · FOUNDER EXTRACTION
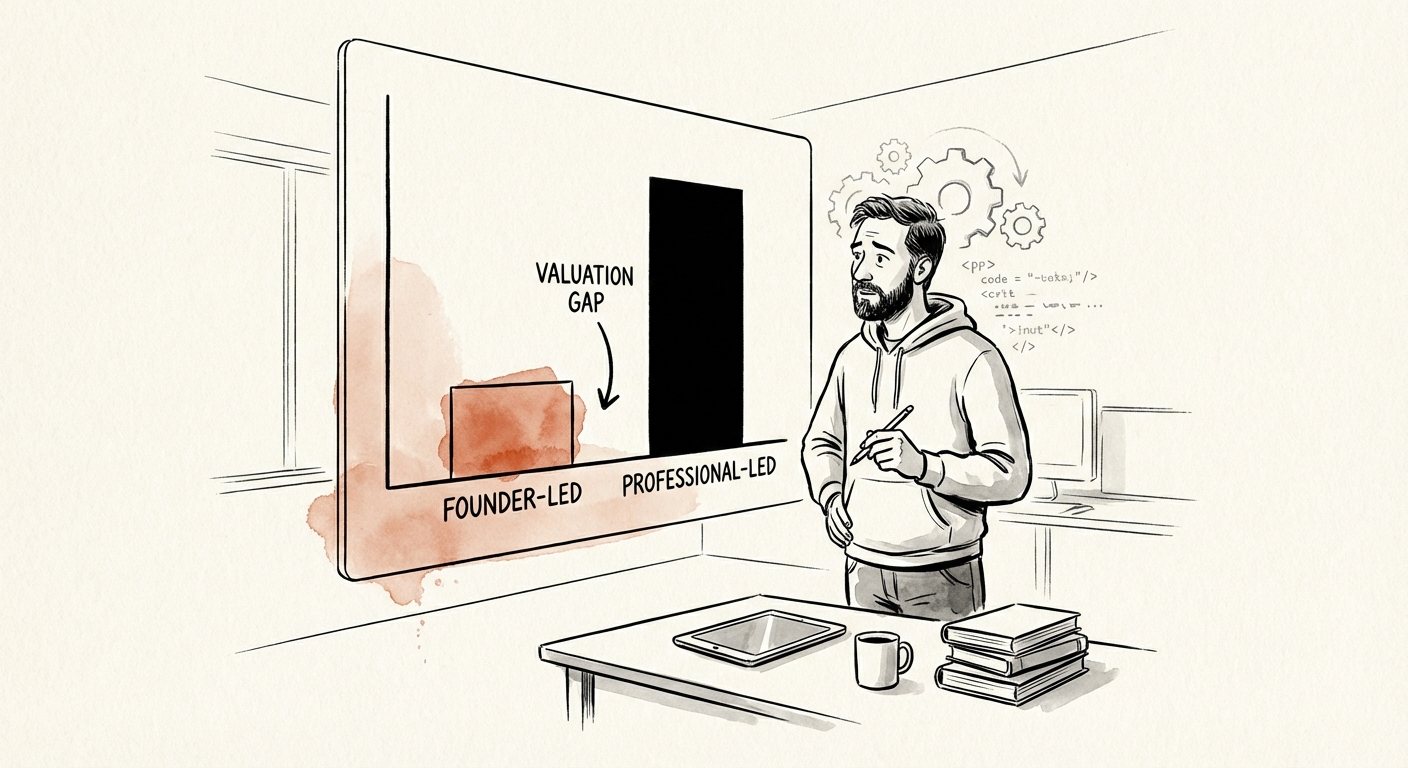
Why Technical Founders Struggle as CEOs (And How to Change)
Founder dependency can reduce enterprise value. Here is the diagnostic on why technical founders struggle to scale and the 'Rich vs. King' framework to fix it.
50% Valuation Discount