BRIEF · TEAM & HIRING
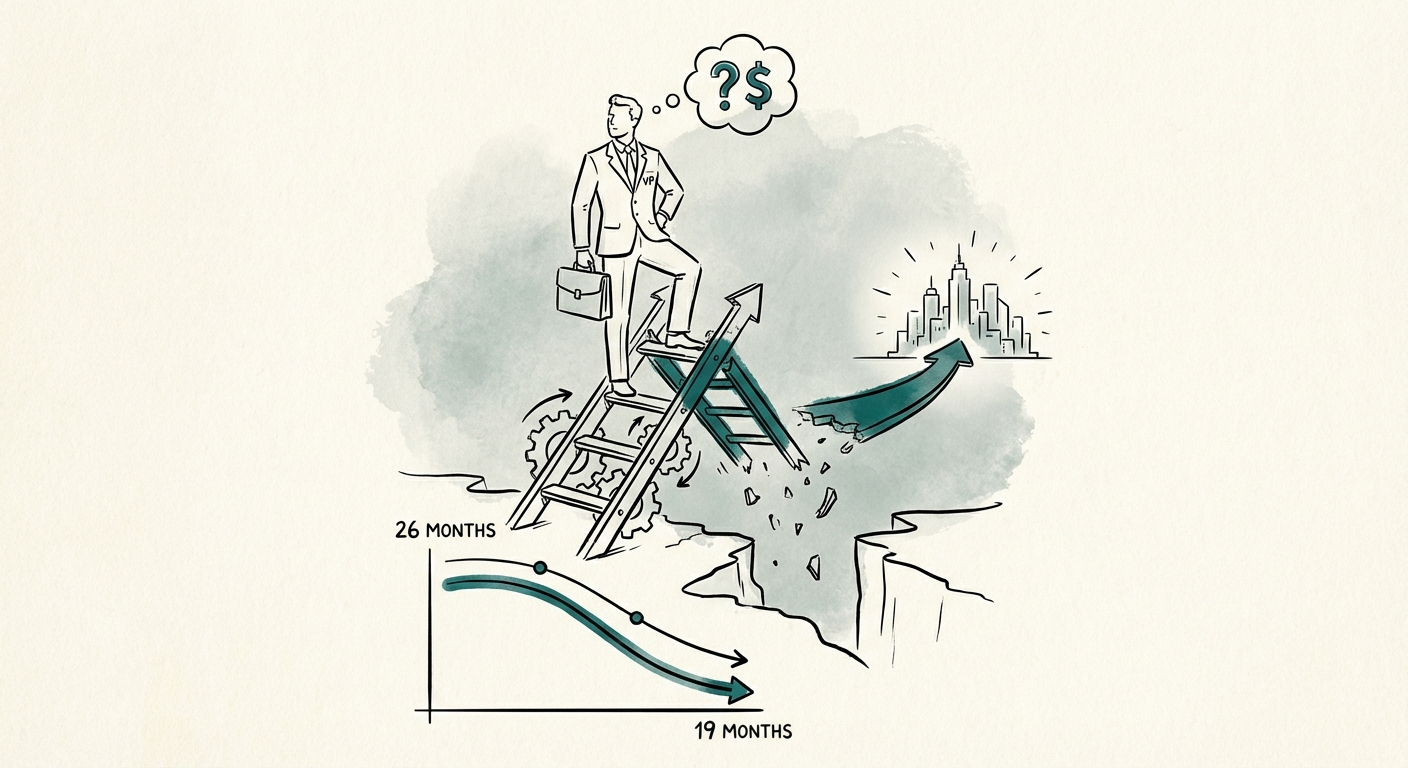
Why Most VP of Sales Hires Fail Within 18 Months: The $2M Mistake Scaling Founders Make
The average VP of Sales tenure has dropped to 19 months. Here is the diagnostic on why 70% of first sales leaders fail and the $2M cost of getting it wrong.
19 Months Avg VP Sales Tenure
BRIEF · FINANCIAL INFRASTRUCTURE
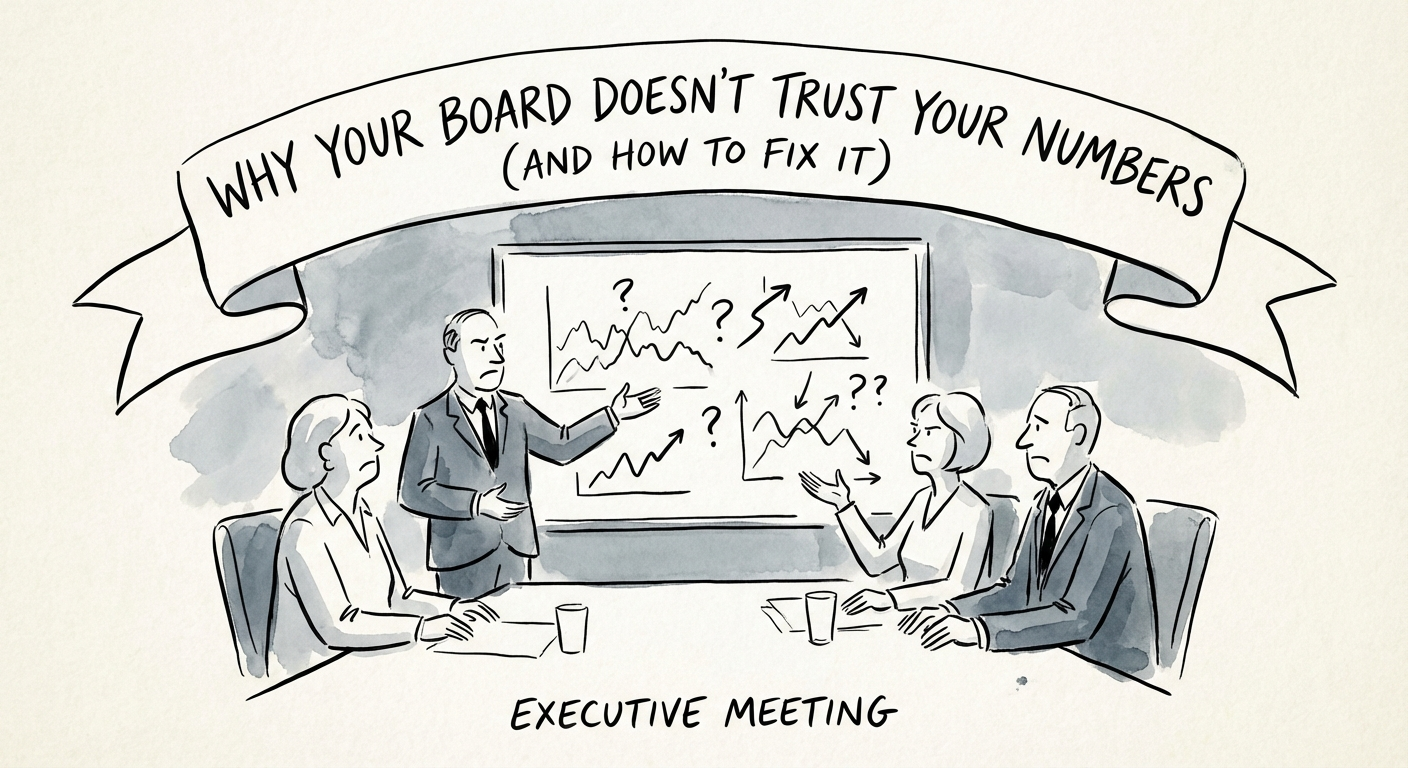
Why Your Board Doesn't Trust Your Numbers (And How to Fix It)
Only 27% of CFOs fully trust their data. Learn why board reporting fails and how to build financial infrastructure that restores credibility.
27% CFOs Who Trust Their Data
BRIEF · REVENUE ARCHITECTURE
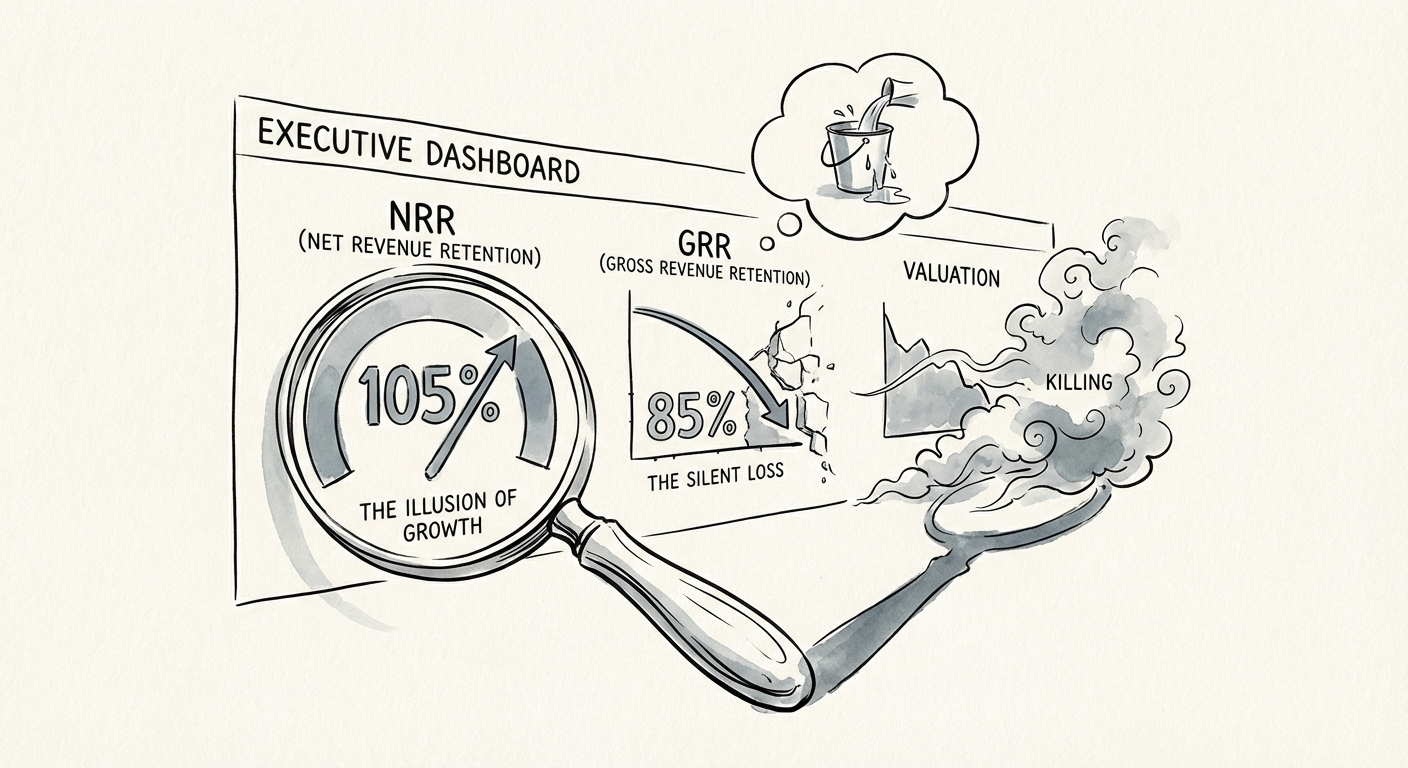
The NRR Illusion: Why Your "Healthy" 105% Retention Is Actually Killing Your Valuation
Your 105% NRR is masking a churn crisis. New 2025 benchmarks reveal why median SaaS retention is failing and how to fix your GRR gap.
16% The Hidden Churn Gap (NRR vs GRR)
BRIEF · COMPLIANCE & SECURITY
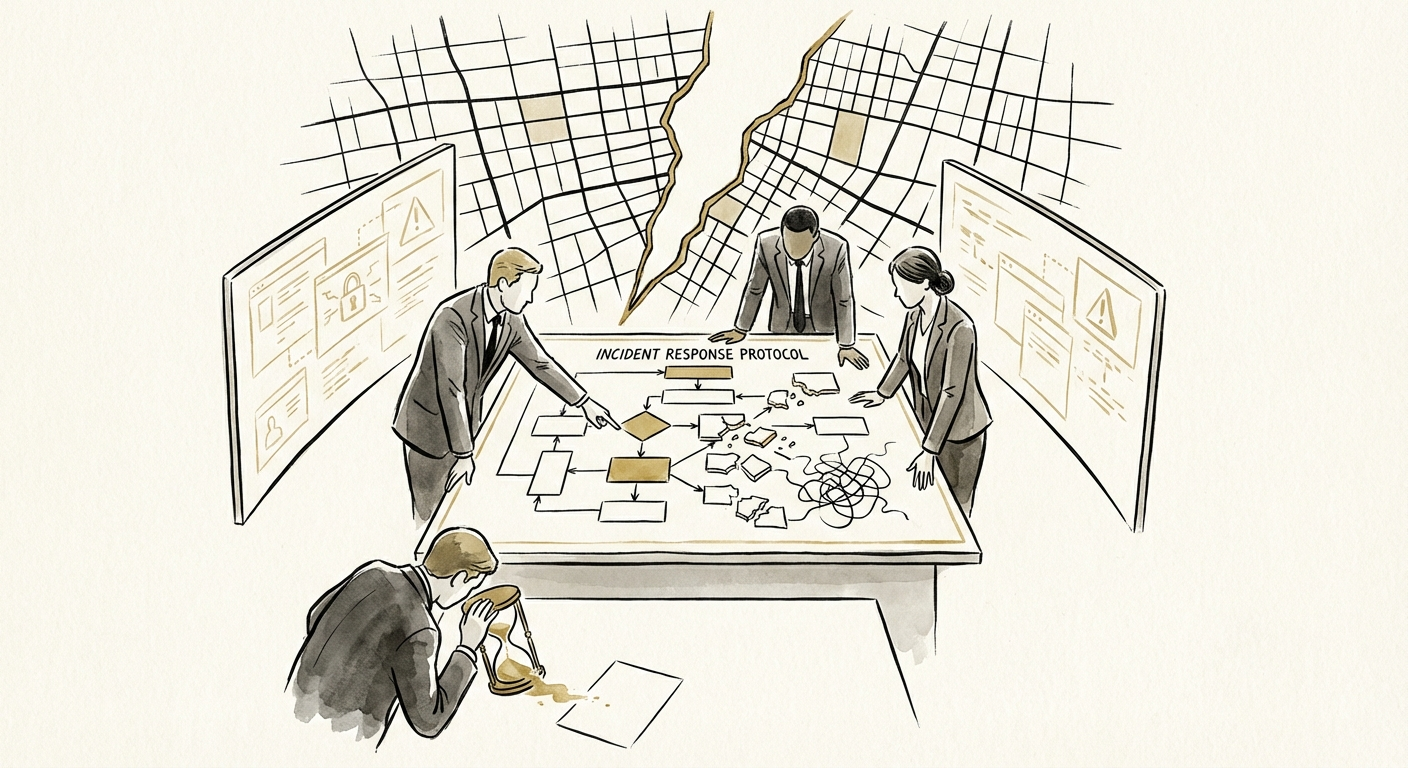
Why Incident Response Plans Fail in Real Incidents
An incident response plan is not enough unless it has been tested. Learn how to turn the document into a practical response capability.
$2.03M Savings from Tested IR
BRIEF · REVENUE ARCHITECTURE
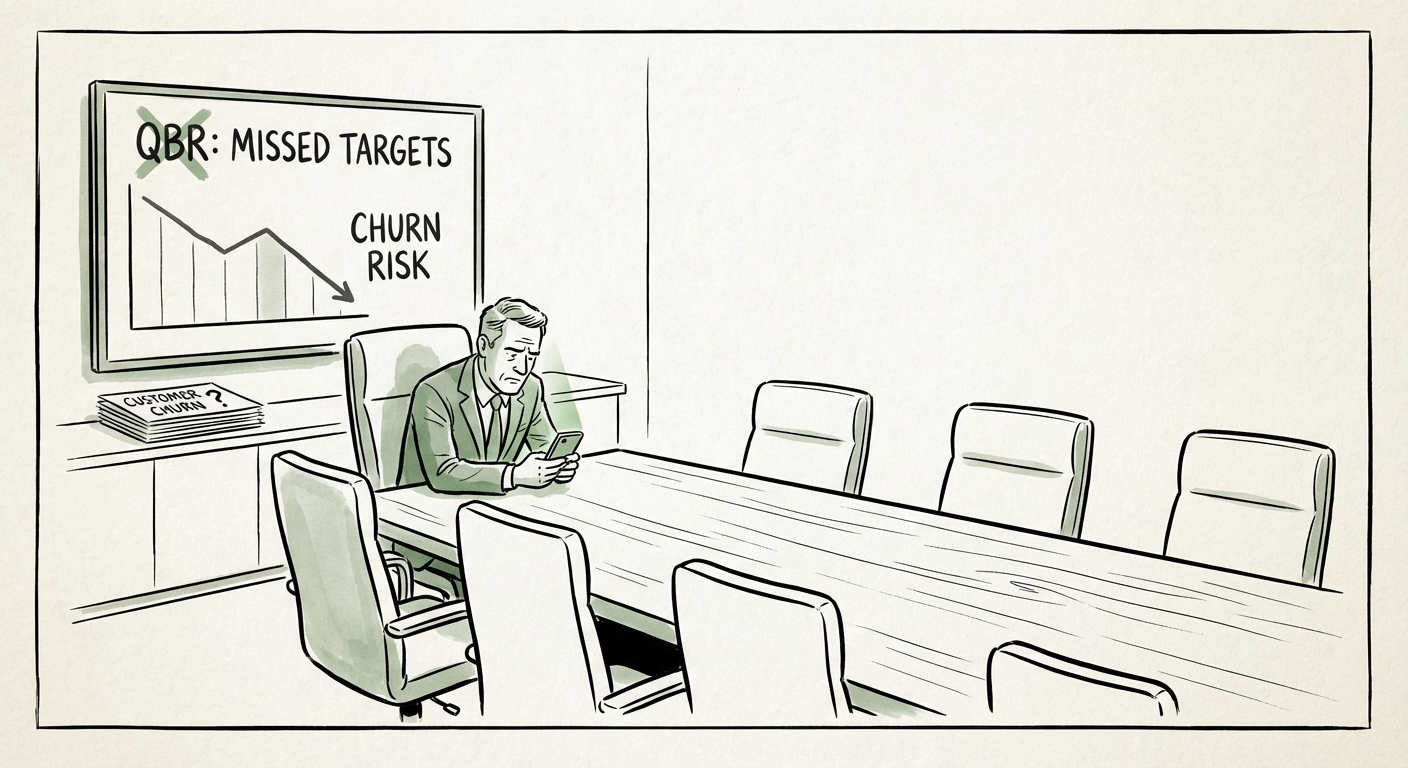
Why Your Quarterly Business Review Isn't Preventing Churn
Data shows 67% of QBRs fail to deliver value. Learn why your Customer Success reviews are actually accelerating churn and how to pivot to Outcome-Based Planning.
67% Of QBRs Fail to Deliver Value
BRIEF · PROCESS DOCUMENTATION
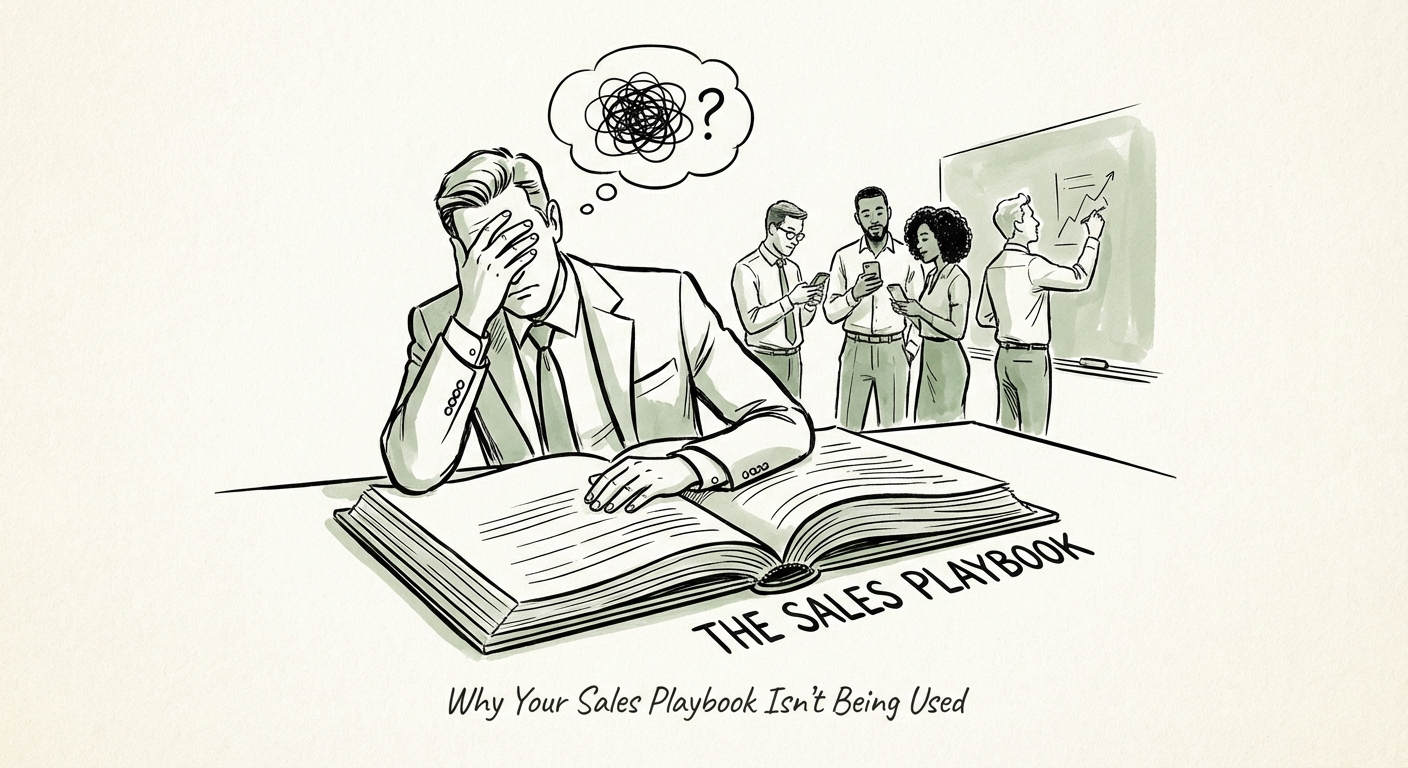
Why Your Sales Playbook Isn't Being Used (And How to Fix It)
65% of sales content goes unused. Discover why your expensive playbook is gathering dust and how to turn it into a dynamic revenue engine. Benchmarks inside.
48% Higher Win Rates
BRIEF · FOUNDER EXTRACTION
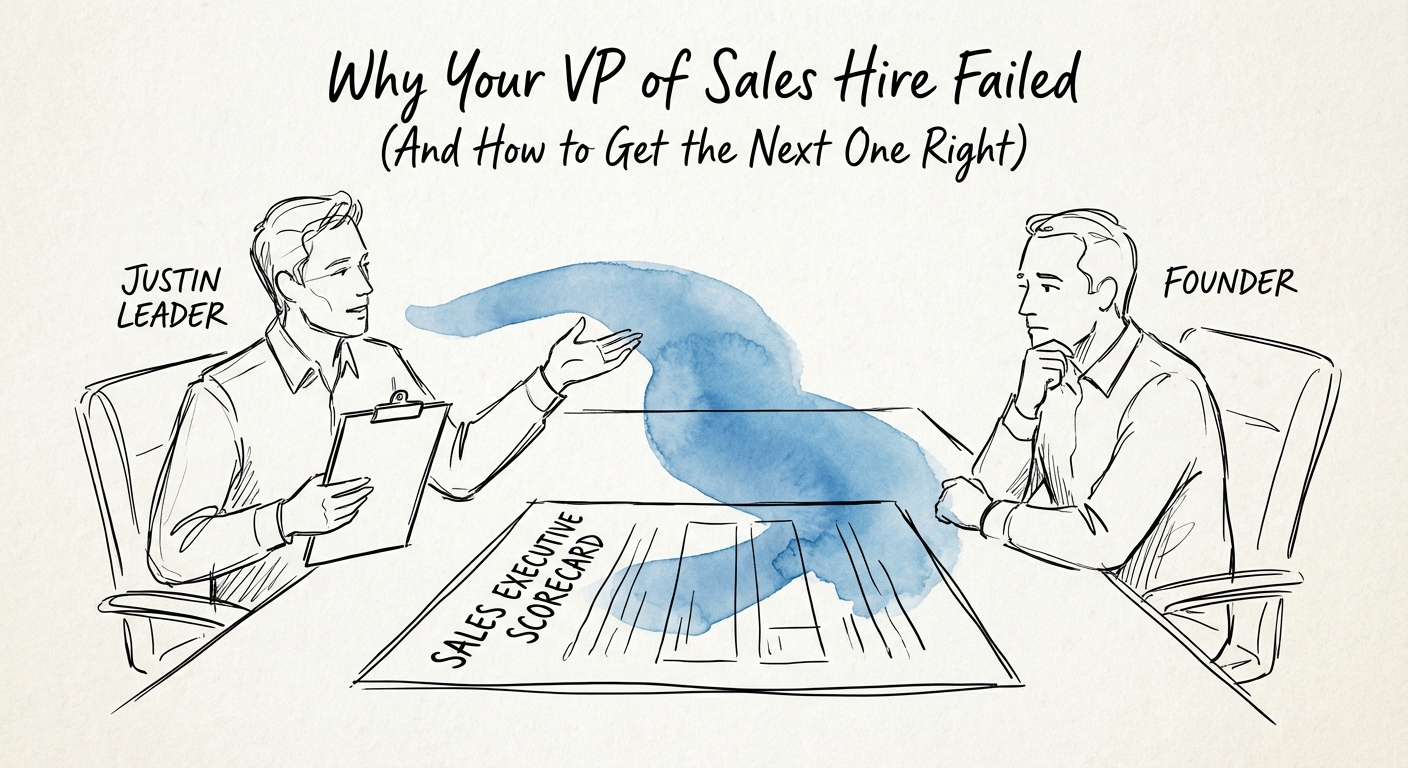
Your VP of Sales Didn't Fail. You Hired a Scaler for a Builder's Job.
The average Series B VP of Sales lasts 18 months. The cause is rarely competence — it's stage mismatch. Here's the diagnostic and the scorecard to hire the right one.
18 Months Avg. Tenure of Series B VP Sales
BRIEF · EXIT READINESS
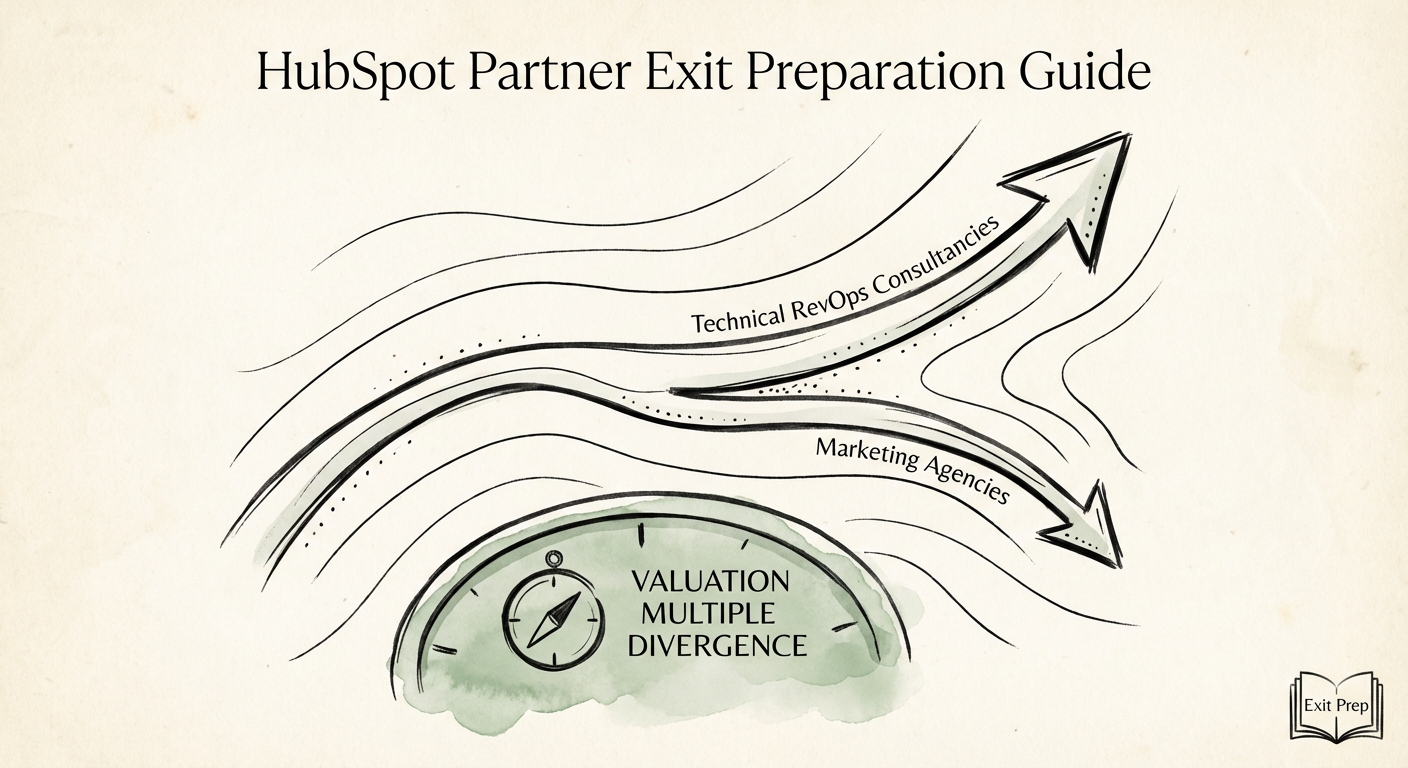
The HubSpot Partner Exit Guide: Why 'Diamond' Status Won't Save Your Multiple
HubSpot Elite partner exit guide for 2026. Discover why technical consultancies trade at 12x while marketing agencies stall at 4x. Benchmarks, valuation drivers, and due diligence prep.
12x Potential EBITDA Multiple for Specialized RevOps Firms
BRIEF · PROCESS DOCUMENTATION
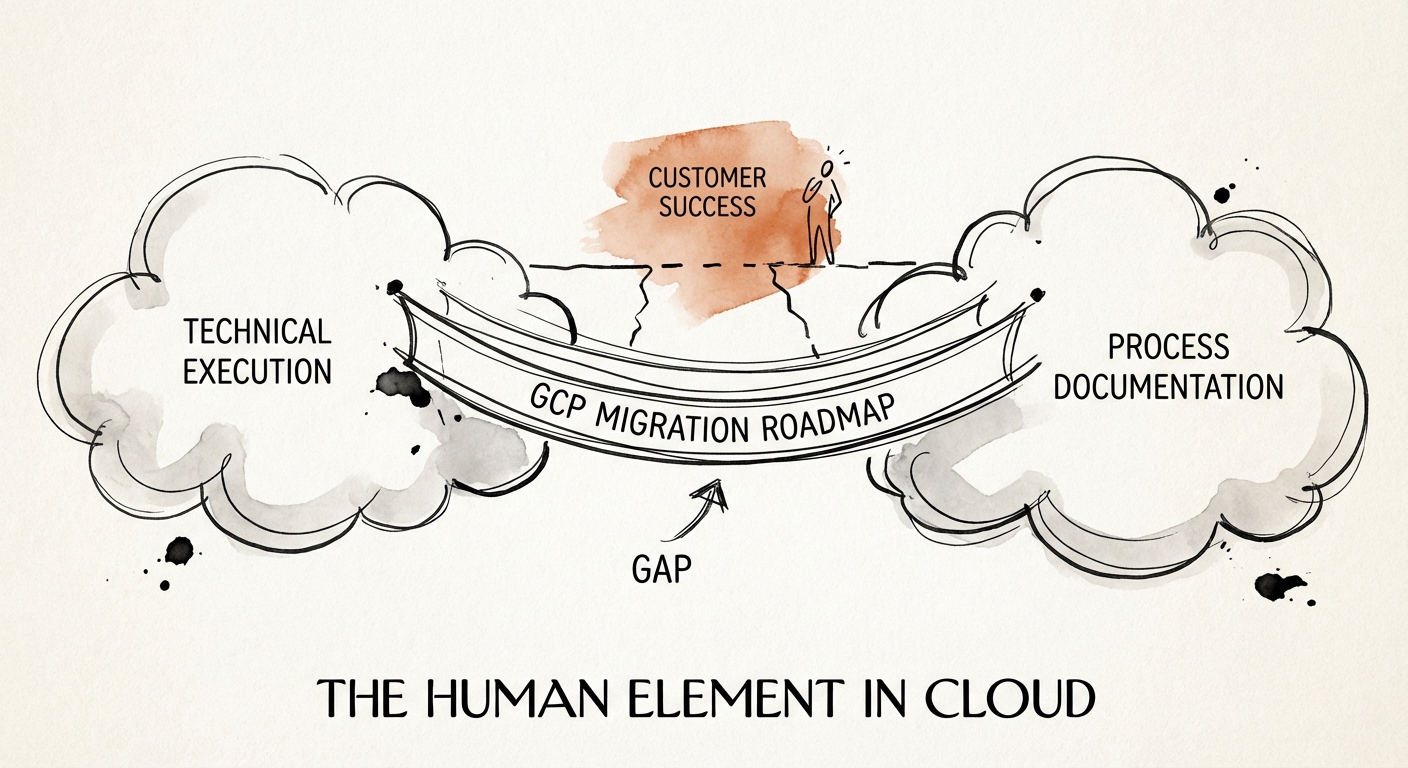
Customer Success in GCP Migrations: The 'Process Gap' That Kills ROI
Why 70% of GCP migrations face delays and cost overruns. A diagnostic guide for Scaling Founders on why 'heroics' fail and how process documentation saves your cloud ROI.
60% Gartner: % of Leaders Facing Cloud Cost Overruns
BRIEF · GTM EXECUTION
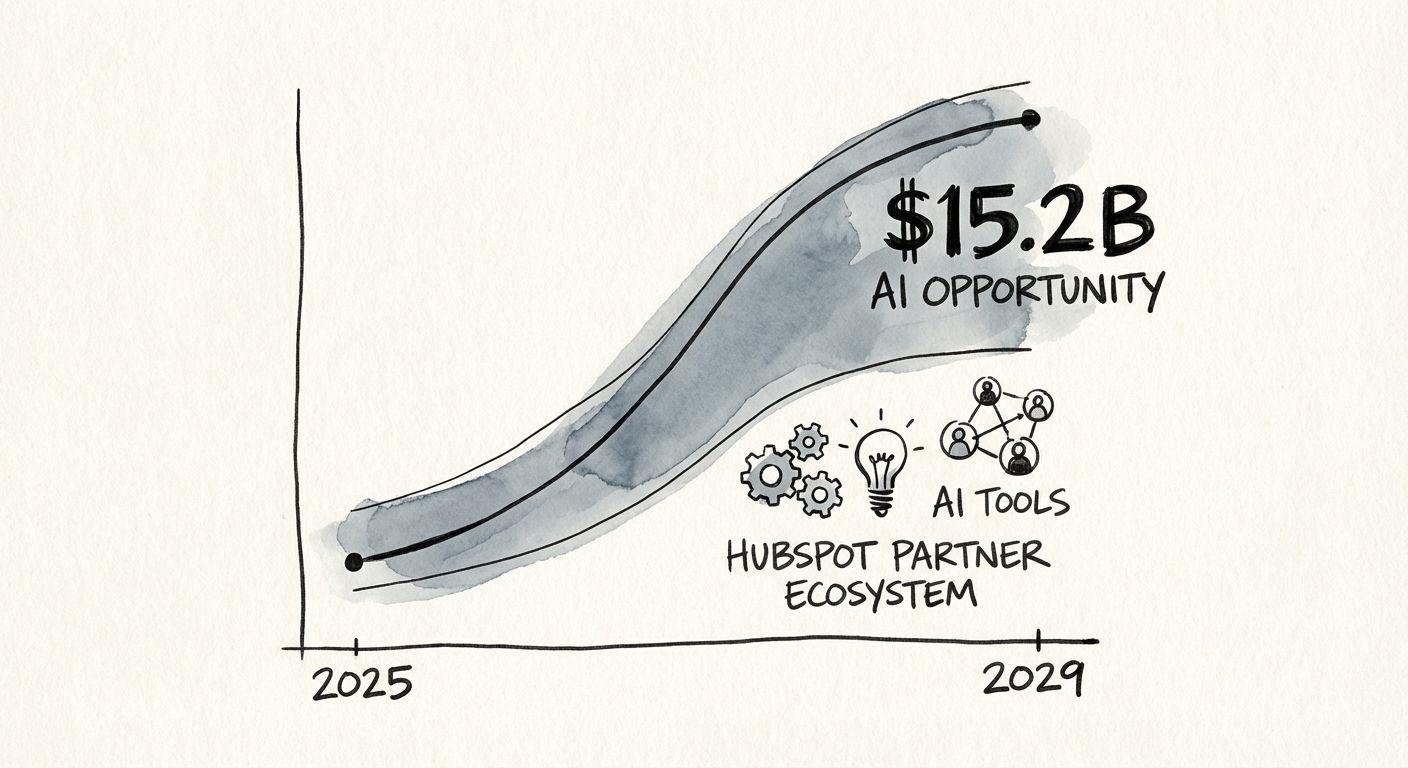
The AI Arbitrage: Why HubSpot Partners Must Pivot from 'Content' to 'Intelligence'
HubSpot's ecosystem is shifting. With AI driving 40% of future growth, partners must pivot from content retainers to technical implementation. Here is the diagnostic guide.
$15.2B AI Partner Revenue Opportunity by 2029
BRIEF · UNIT ECONOMICS
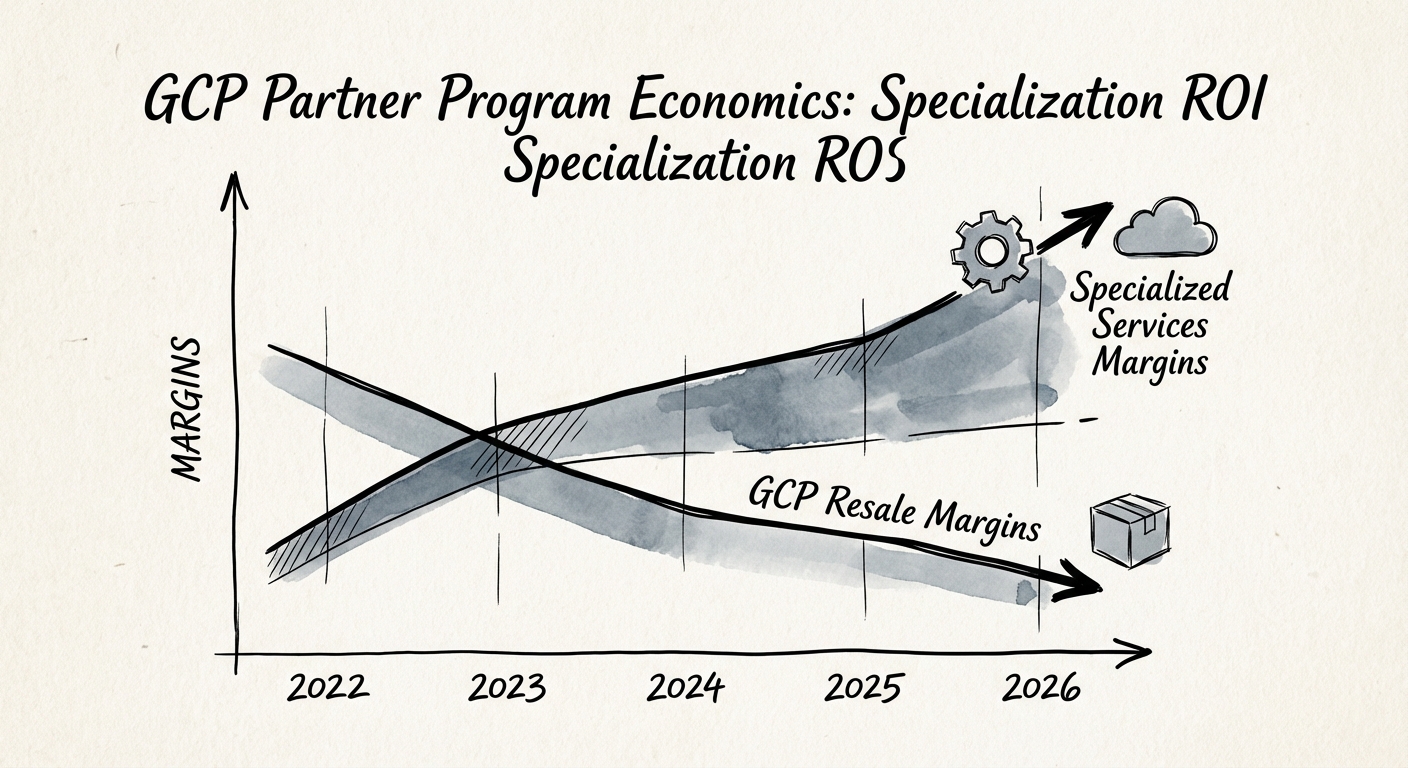
The GCP Partner "Badge Trap": Why Generalists Bleed Margins While Specialists Command Premiums
Generalist Google Cloud Partners are under pressure. Analysis of the $7.54 ecosystem multiplier, the 12% resale margin cliff, and why Specializations are the only path to 10x exits.
$7.54 Partner Revenue Per $1 GCP Sold
BRIEF · UNIT ECONOMICS
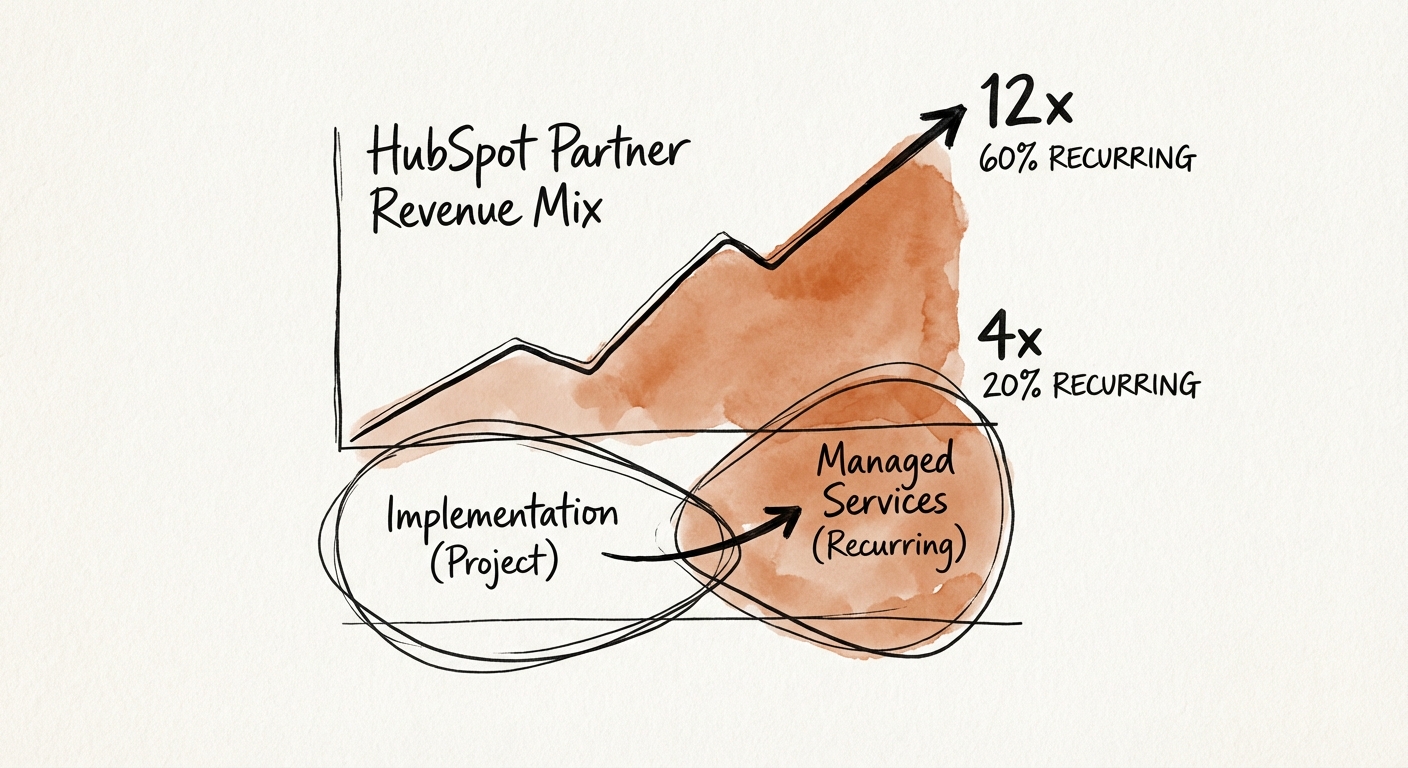
The HubSpot Partner Valuation Trap: Why Your 80% Project Mix Is Costing You a 12x Exit
For HubSpot Partners, revenue mix dictates valuation. Why an 80% project mix caps you at 4x EBITDA, and how to pivot to Managed RevOps for a 10x exit.
60% Recurring Revenue Target
BRIEF · EXIT READINESS
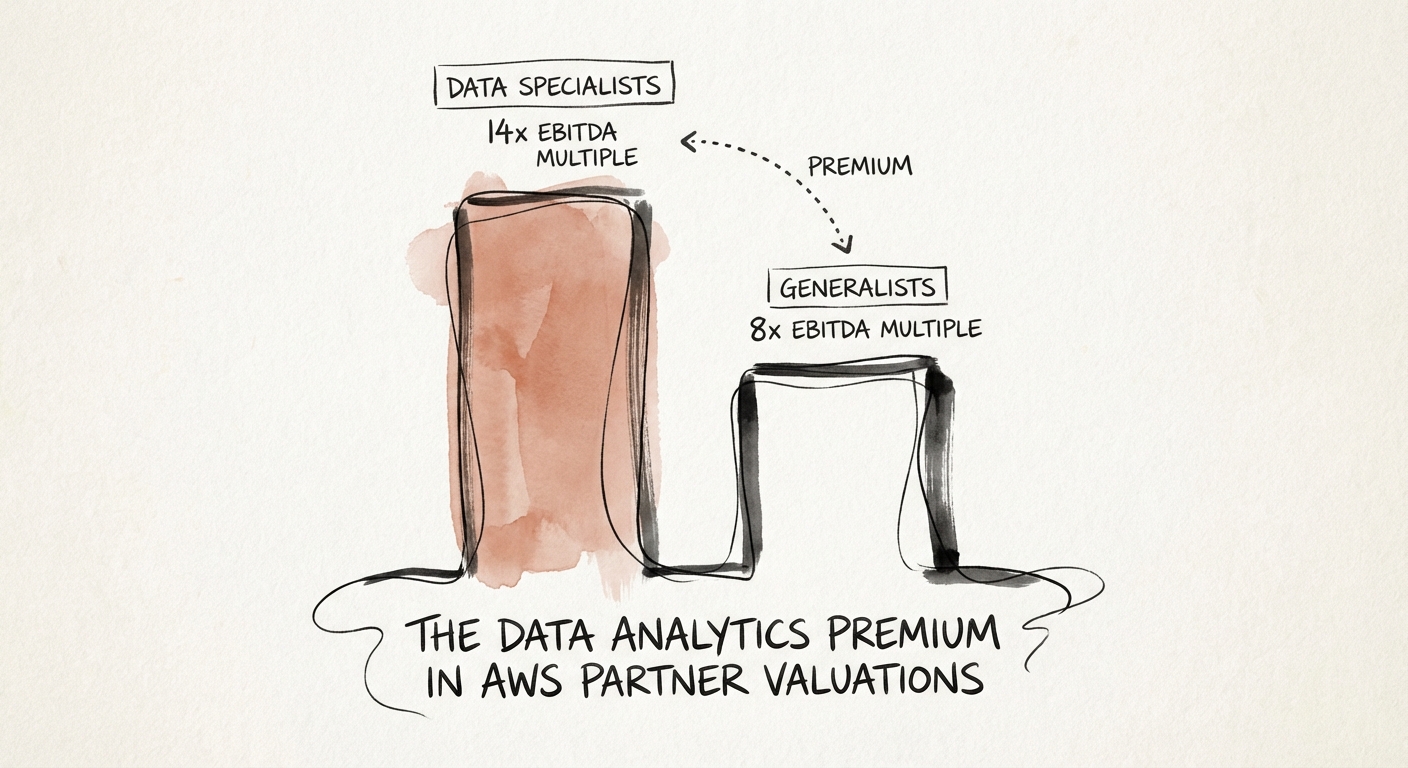
The Data Analytics Premium: Why AWS Generalists Trade at 8x and Data Specialists Command 14x
Why AWS Data & Analytics specialists trade at 14x EBITDA while generalists stall at 8x. A diagnostic guide for PE Operating Partners on unlocking exit value.
14x EBITDA Multiple for Data Specialists
BRIEF · FOUNDER EXTRACTION
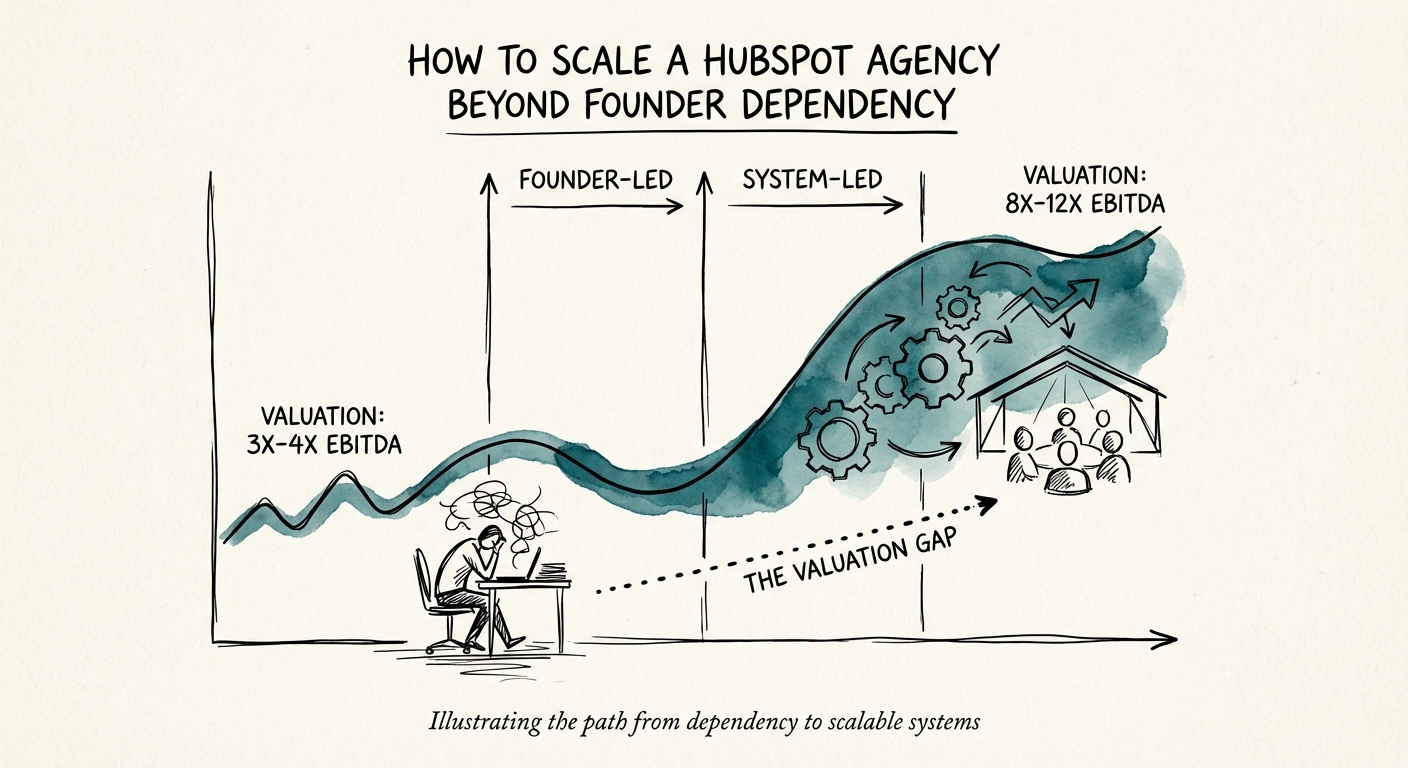
The Platinum Plateau: How to Scale Your HubSpot Agency Beyond Founder Dependency
Stuck at the 'Platinum Plateau'? Learn how to break the founder bottleneck, meet 2026 Sourced Points requirements, and increase your agency's valuation multiple from 3x to 8x.
50% Valuation Haircut
BRIEF · EXIT READINESS
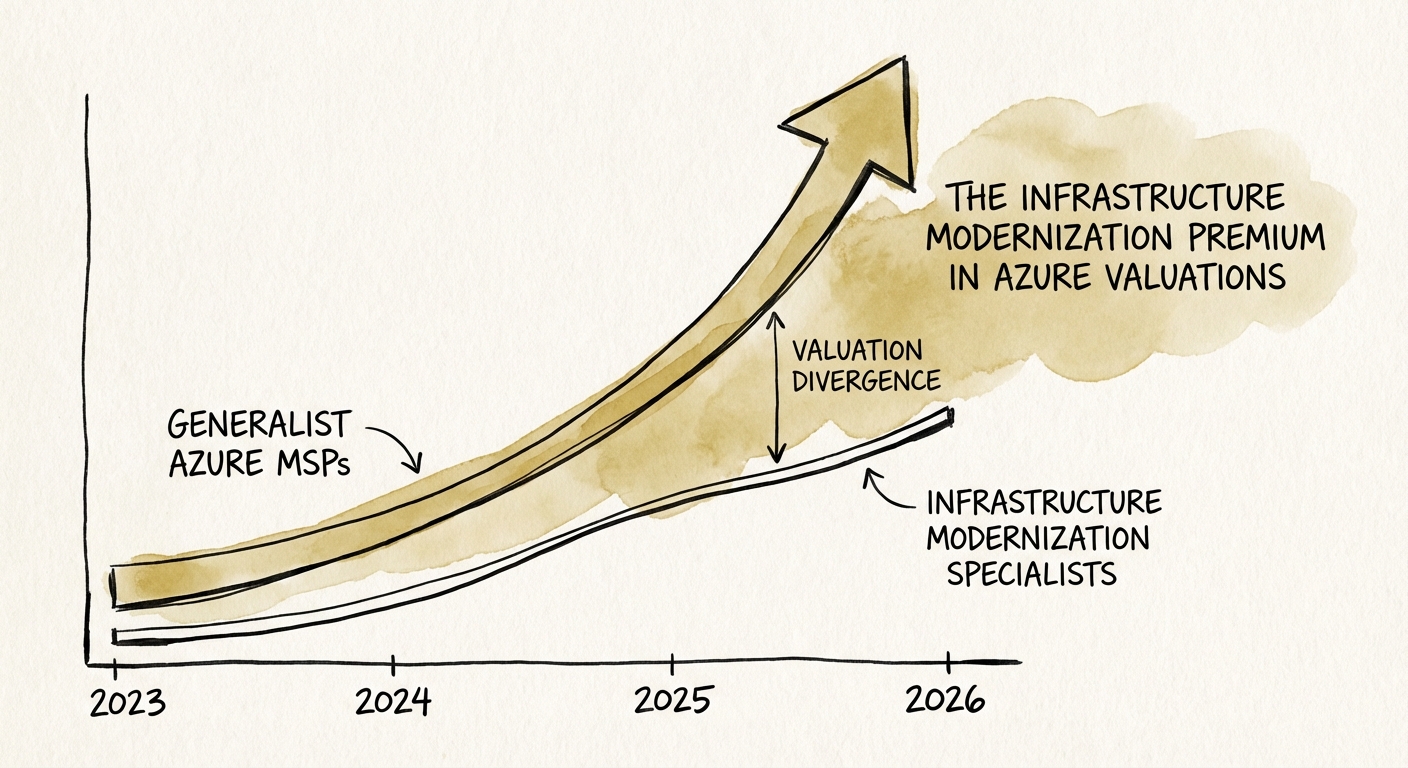
The Infrastructure Modernization Premium: Why 'Lift and Shift' Azure Shops Are Trading at a 40% Discount
Why "lift and shift" Azure partners trade at 7x EBITDA while modernization specialists command 13x. A diagnostic guide for PE Operating Partners.
5.5x EBITDA Multiple Gap
BRIEF · EXIT READINESS
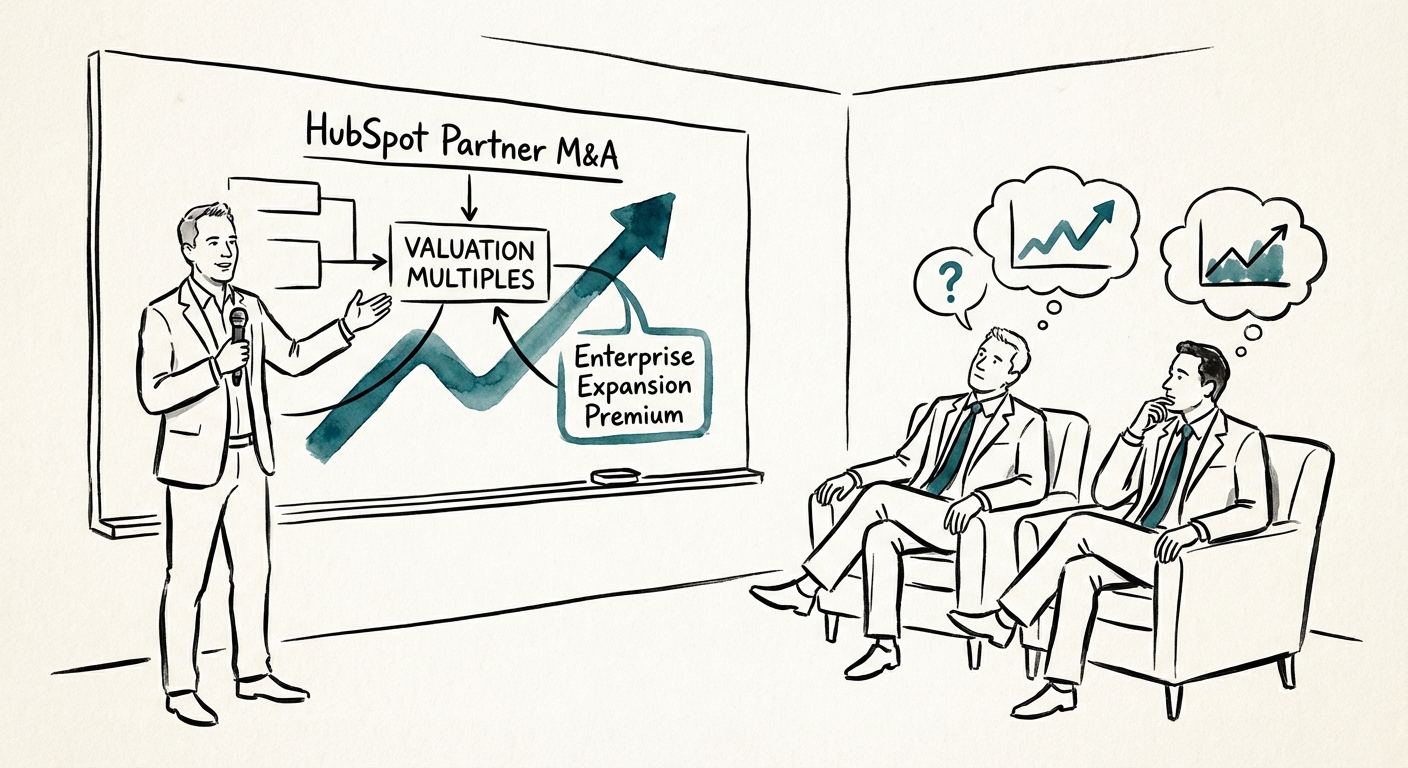
The Enterprise Expansion Premium in HubSpot Partner M&A
Why technical HubSpot consultancies trade at 12x EBITDA while marketing agencies stall at 5x. A guide for PE Operating Partners on the 2026 'Enterprise Expansion Premium'.
12x Target EBITDA Multiple
BRIEF · EXIT READINESS
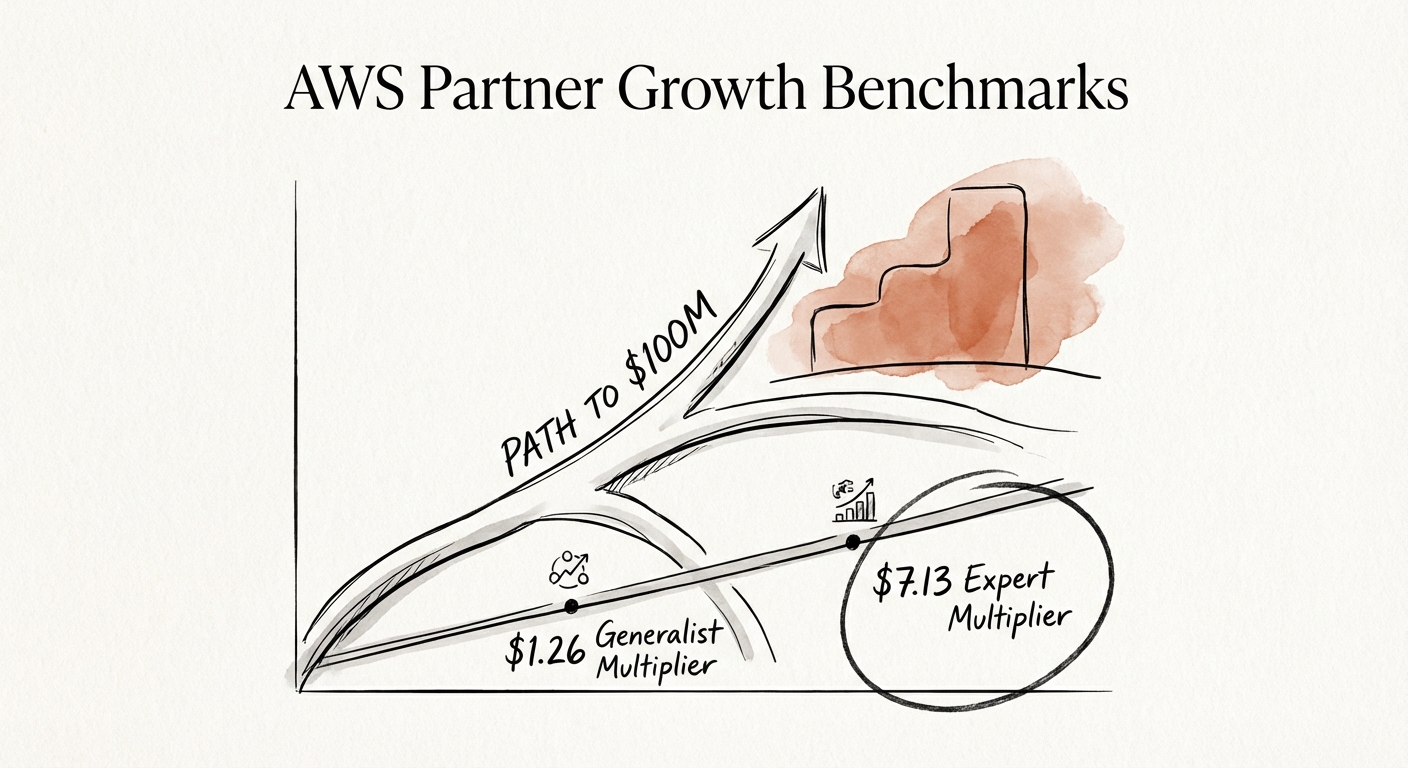
AWS Partner Growth Benchmarks: Why You're Stalling at $20M (And How to Reach $100M)
New data reveals the $7.13 revenue multiplier gap separating 'Advanced' AWS partners from 'Premier' scale-ups. A diagnostic guide for CEOs stalled at $20M.
$7.13 Service Revenue Per $1 AWS Sold (Expert Partners)
BRIEF · UNIT ECONOMICS
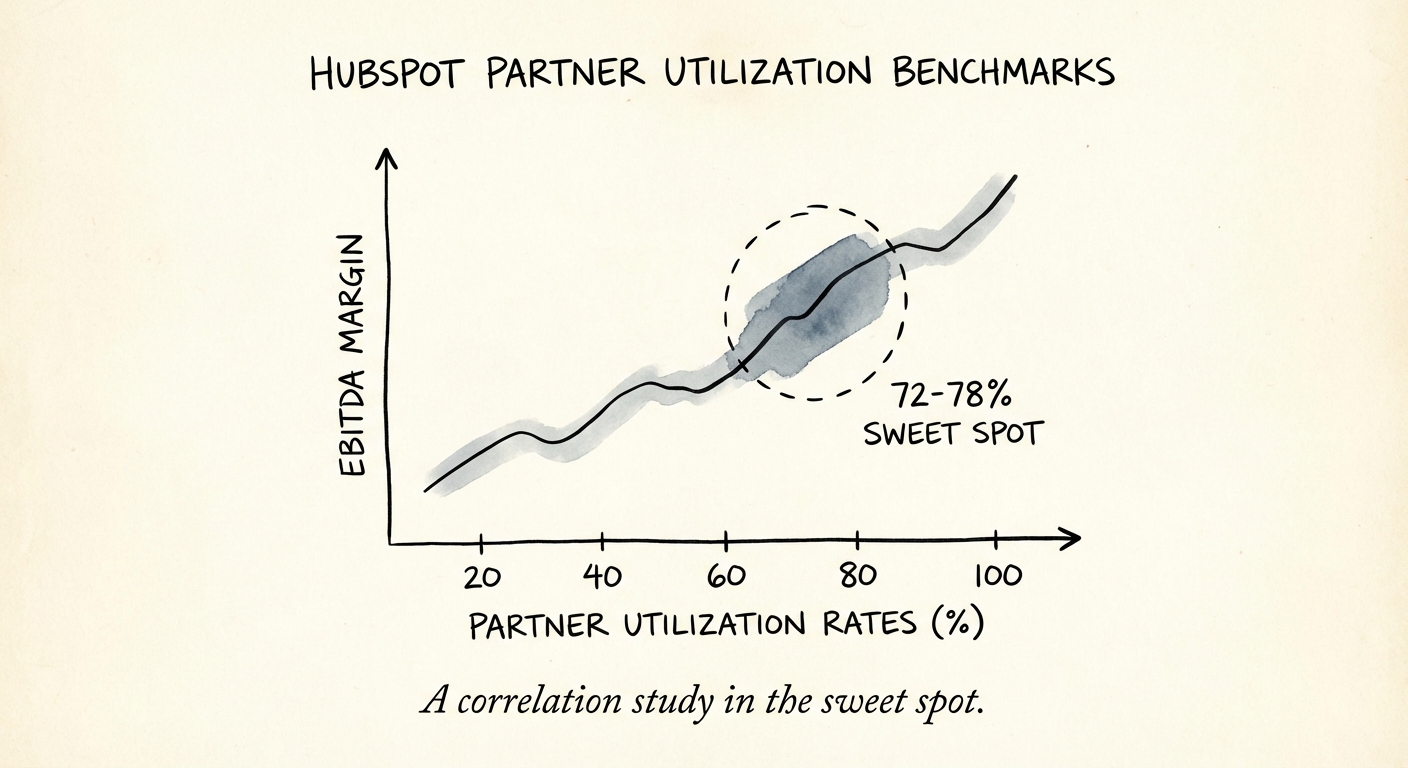
HubSpot Partner Utilization Benchmarks: Why 85% Is a Trap (And the 72% Sweet Spot for 2026)
New 2026 data: Why 85% utilization kills HubSpot agencies. Benchmarks for Elite vs. Gold partners, role-based targets, and the EBITDA impact of 'busy work.'
72-78% Optimal Billable Utilization Range
BRIEF · TECHNICAL DEBT
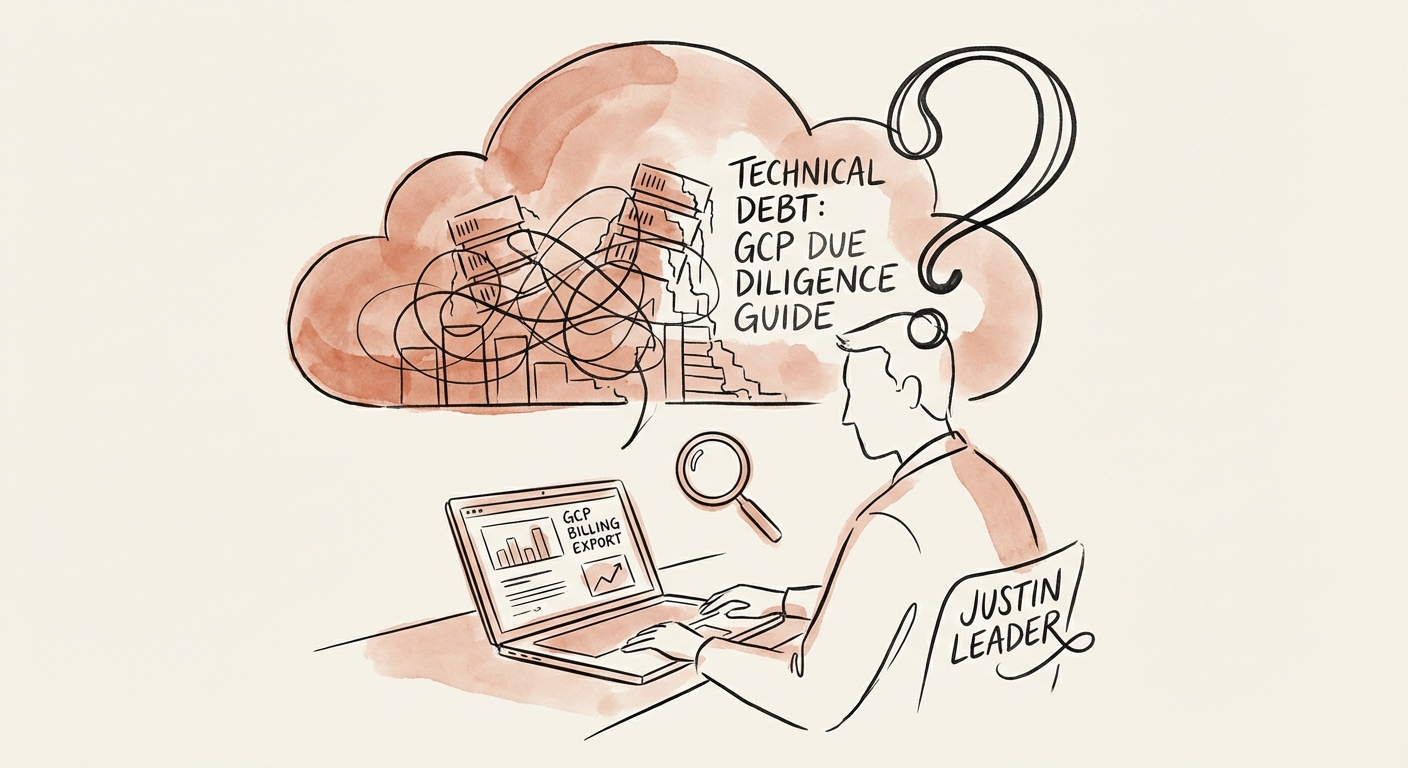
The "GCP Tax": Why Google Cloud Technical Debt Is Silent EBITDA Erosion (And How to Audit It)
How to quantify Google Cloud technical debt before acquiring. Specific audit points for BigQuery, GKE, and IAM that impact EBITDA and valuation.
32% Avg. Wasted Cloud Spend
BRIEF · EXIT READINESS
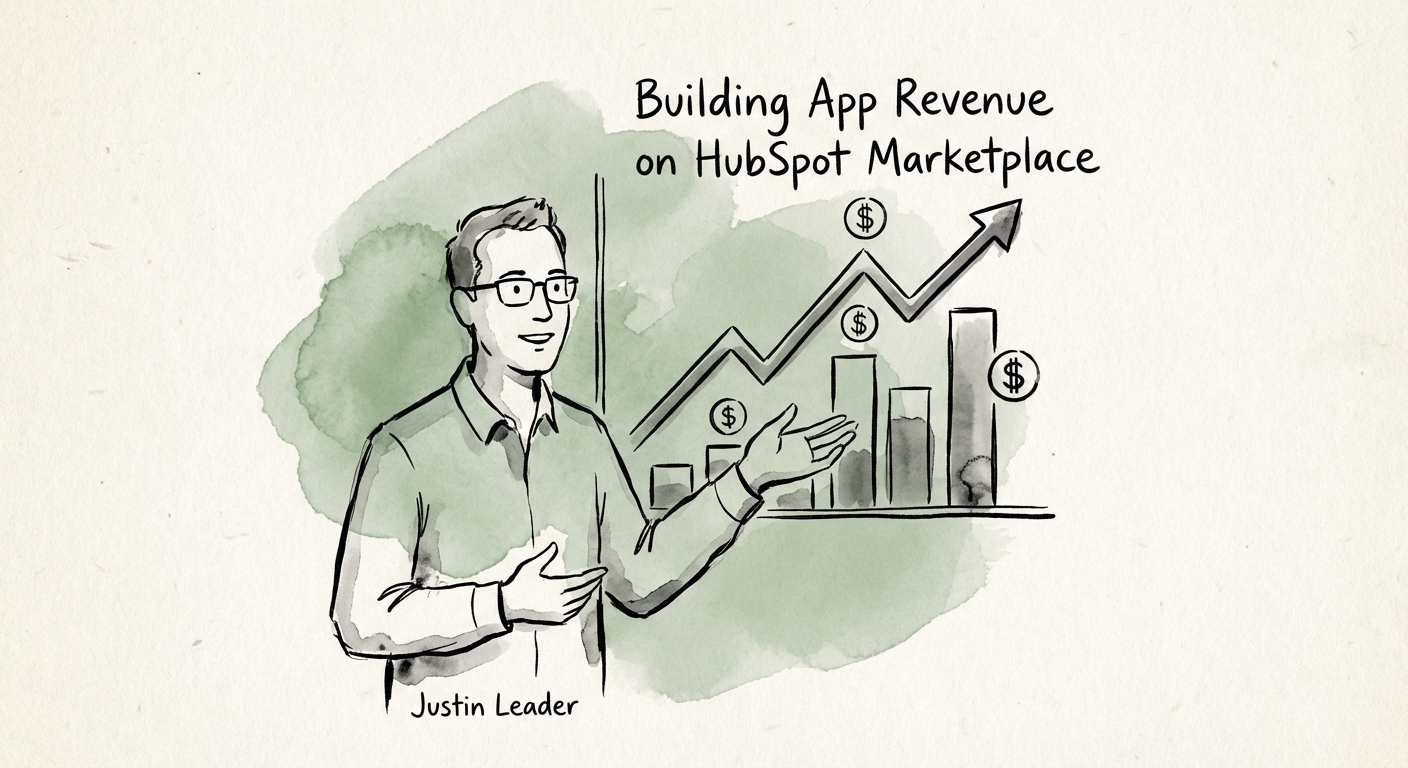
Building App Revenue on HubSpot Marketplace: The ISV Valuation Playbook
HubSpot's ecosystem is a real opportunity, but thin connector apps can be difficult to underwrite. Here is the diagnostic playbook for building durable ISV revenue in 2026.
4 Product Signals Buyers Review
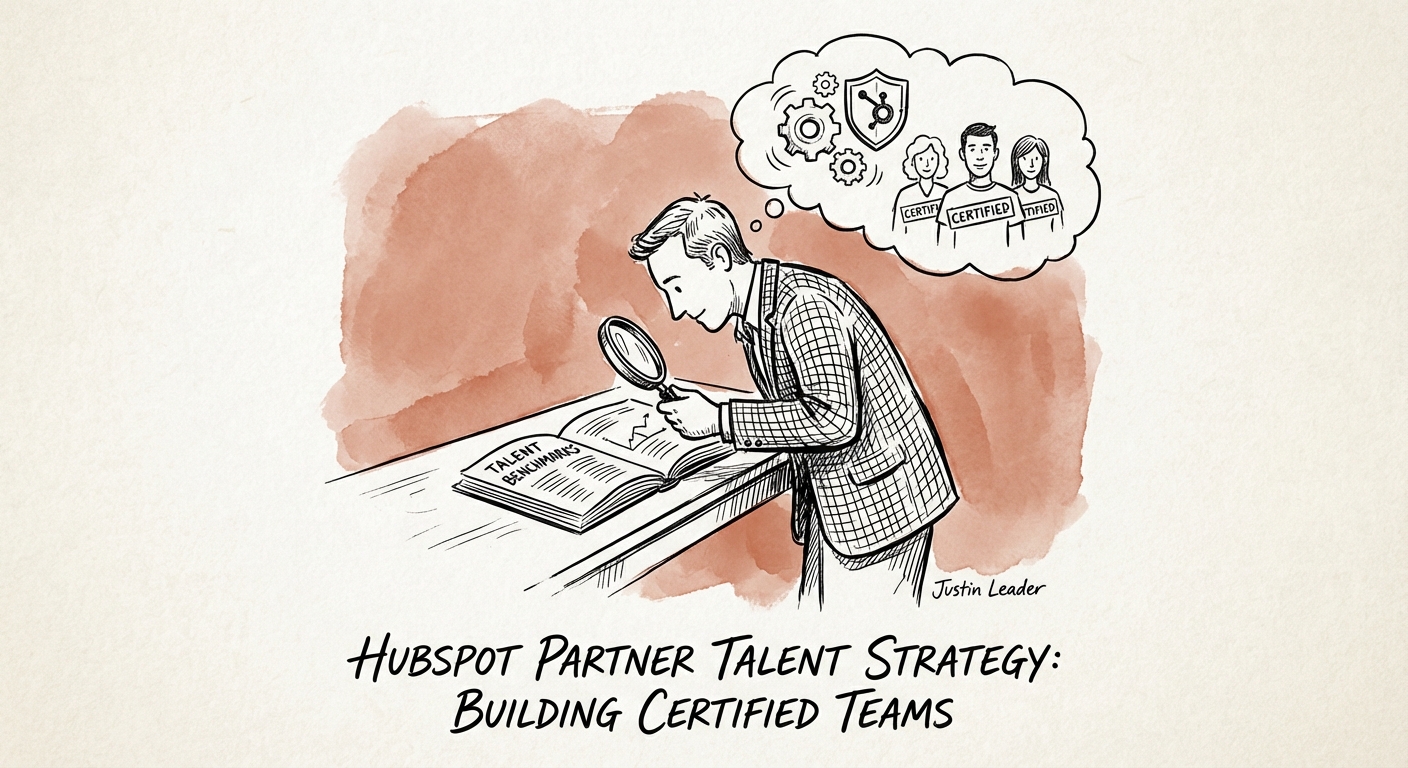
BRIEF · TEAM & HIRING
The HubSpot Talent Trap: Why Your 'Certified' Team Can't Scale
HubSpot is moving upmarket, but most partners are stuck in 'agency mode.' Here is the diagnostic to building a technical delivery team that drives 25% margins.
$50,000 Salary Delta (Admin vs. Architect)
BRIEF · EXIT READINESS
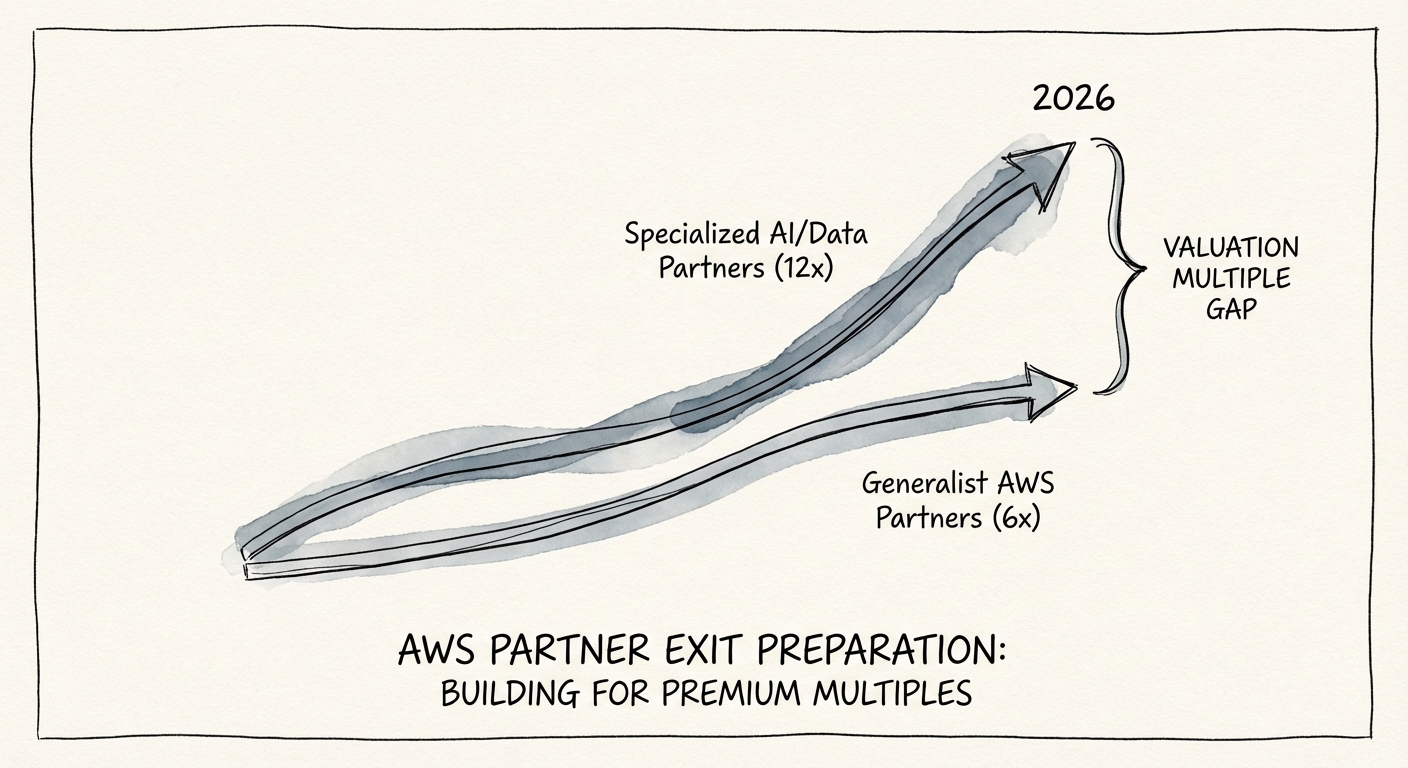
AWS Partner Exit Preparation: The Gap Between 6x and 12x
Generalist AWS partners trade at 6x EBITDA. Specialists trade at 12x. Here is the 18-month diagnostic roadmap to bridge the valuation gap before you sell.
11.4x Median MSP EBITDA Multiple (2025)
BRIEF · EXIT READINESS
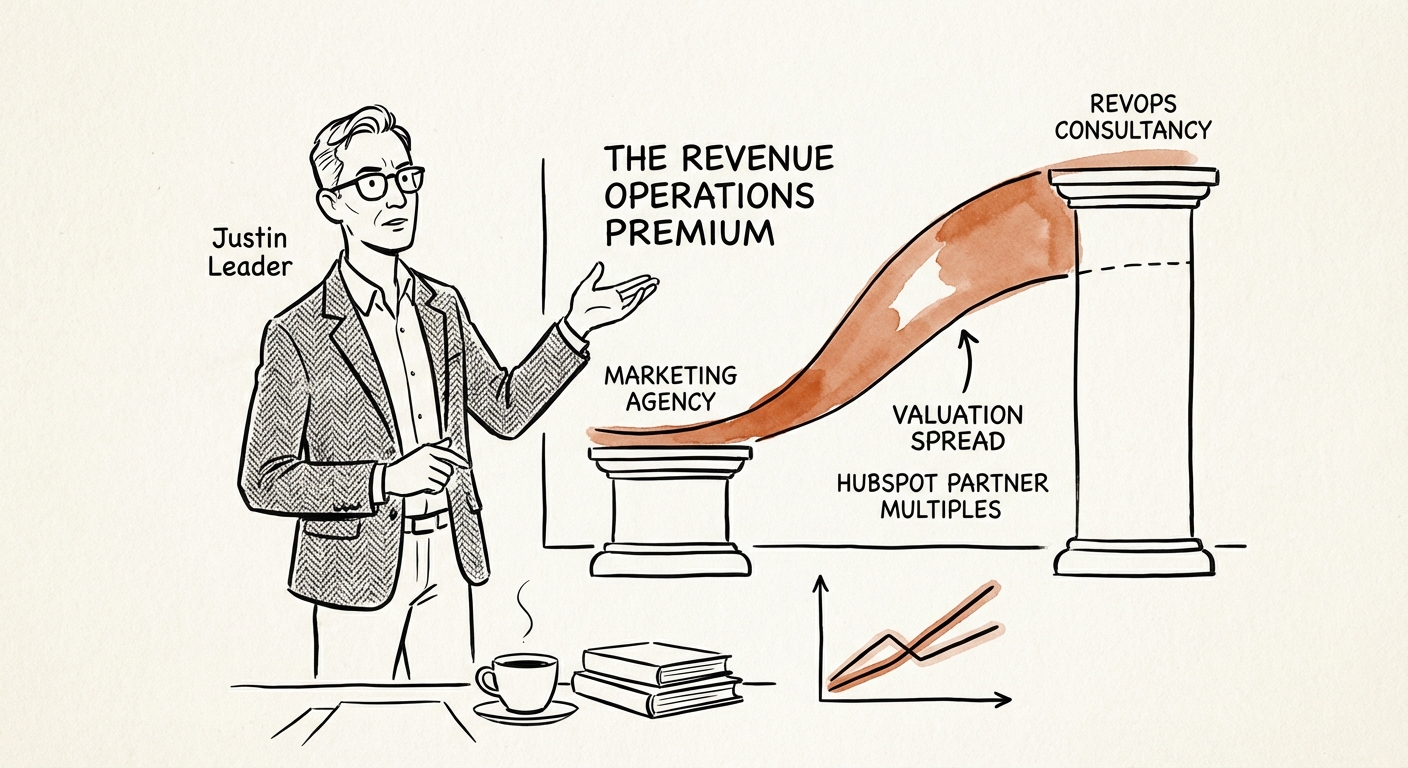
The Revenue Operations Premium: Why RevOps Shops Trade at 12x and Agencies Stall at 5x
Why RevOps consultancies trade at 12x EBITDA while marketing agencies stall at 5x. A diagnostic guide for HubSpot partners and PE investors on the 2026 valuation gap.
12x RevOps EBITDA Multiple
BRIEF · REVENUE ARCHITECTURE
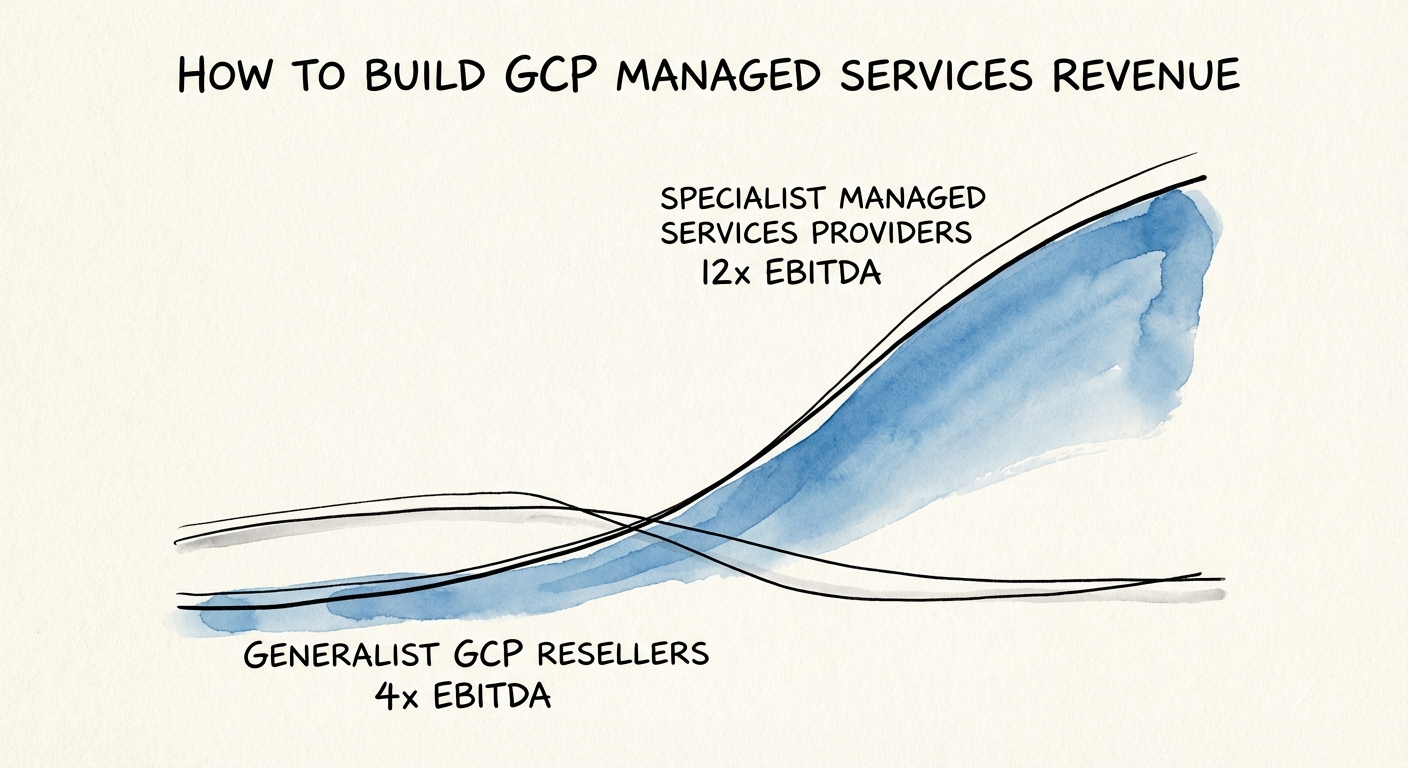
How to Build GCP Managed Services Revenue: The 2026 Playbook
Stop chasing 3% resell margins. Here is the operator's guide to building high-margin GCP Managed Services revenue, targeting the 2026 Partner Network changes and 12x exit multiples.
12x EBITDA Multiple Target