BRIEF · PROJECT RECOVERY
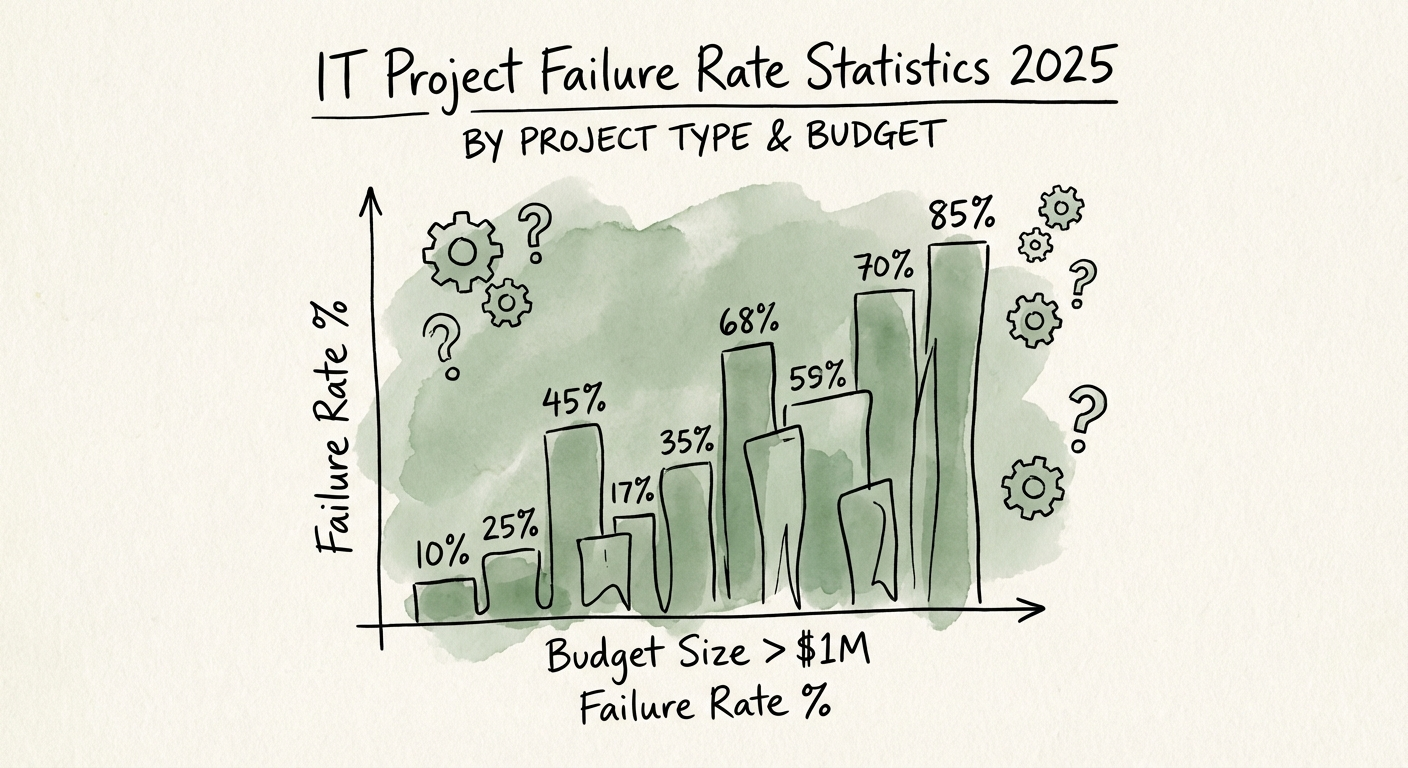
IT Project Failure Rates 2025: The Budget Cliff Nobody Approves For
A project's failure odds jump the moment its budget crosses $1M. 2025 failure rates by budget tier and by type (ERP, digital transformation), with the math.
70% Digital Transformation Failure Rate
BRIEF · PROJECT RECOVERY
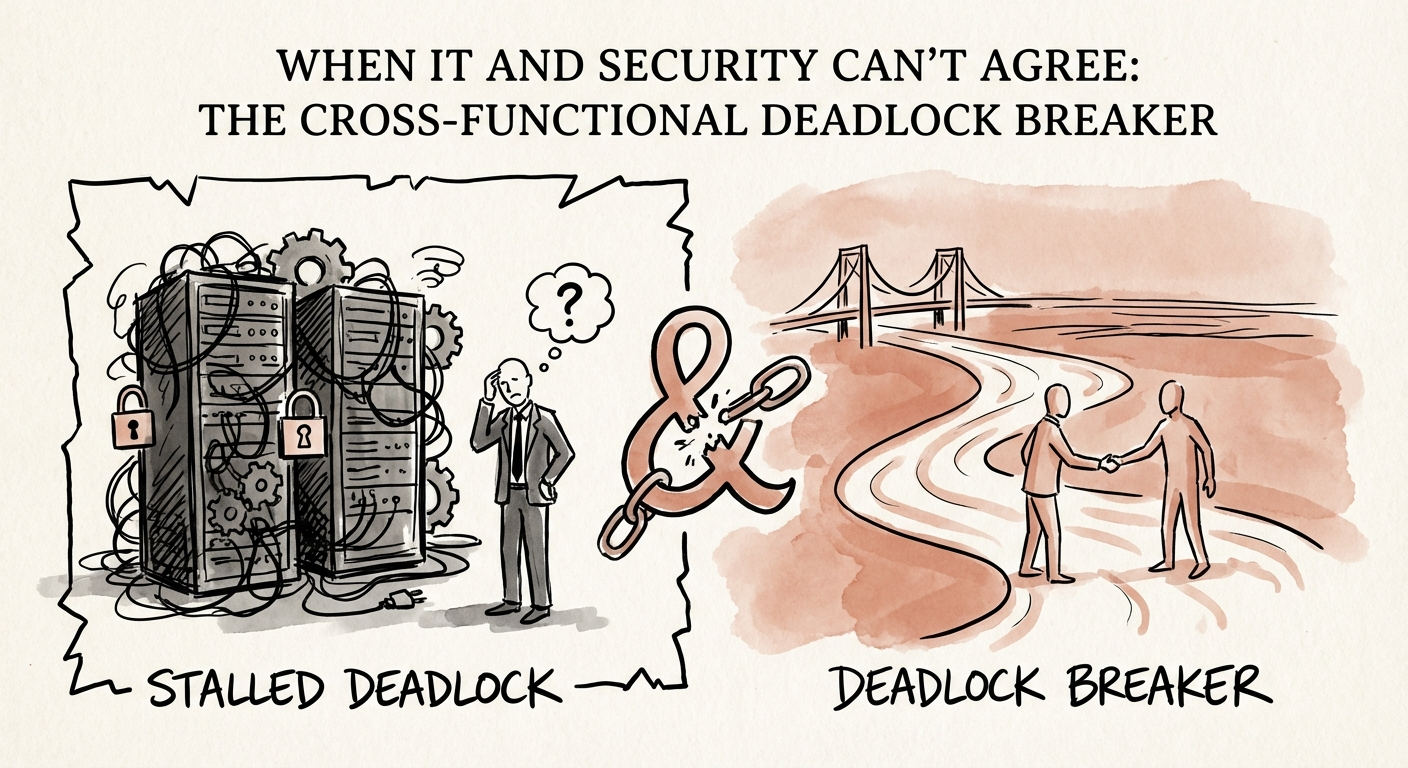
The 53% Tax: How to Break the IT-Security Deadlock That’s Killing Your Launch
53% of enterprise projects are delayed by IT-Security misalignment. Here is the operator's guide to breaking the deadlock, automating governance, and unblocking your $3M initiative in 30 days.
53% Projects Delayed by Governance Misalignment
BRIEF · EXIT READINESS
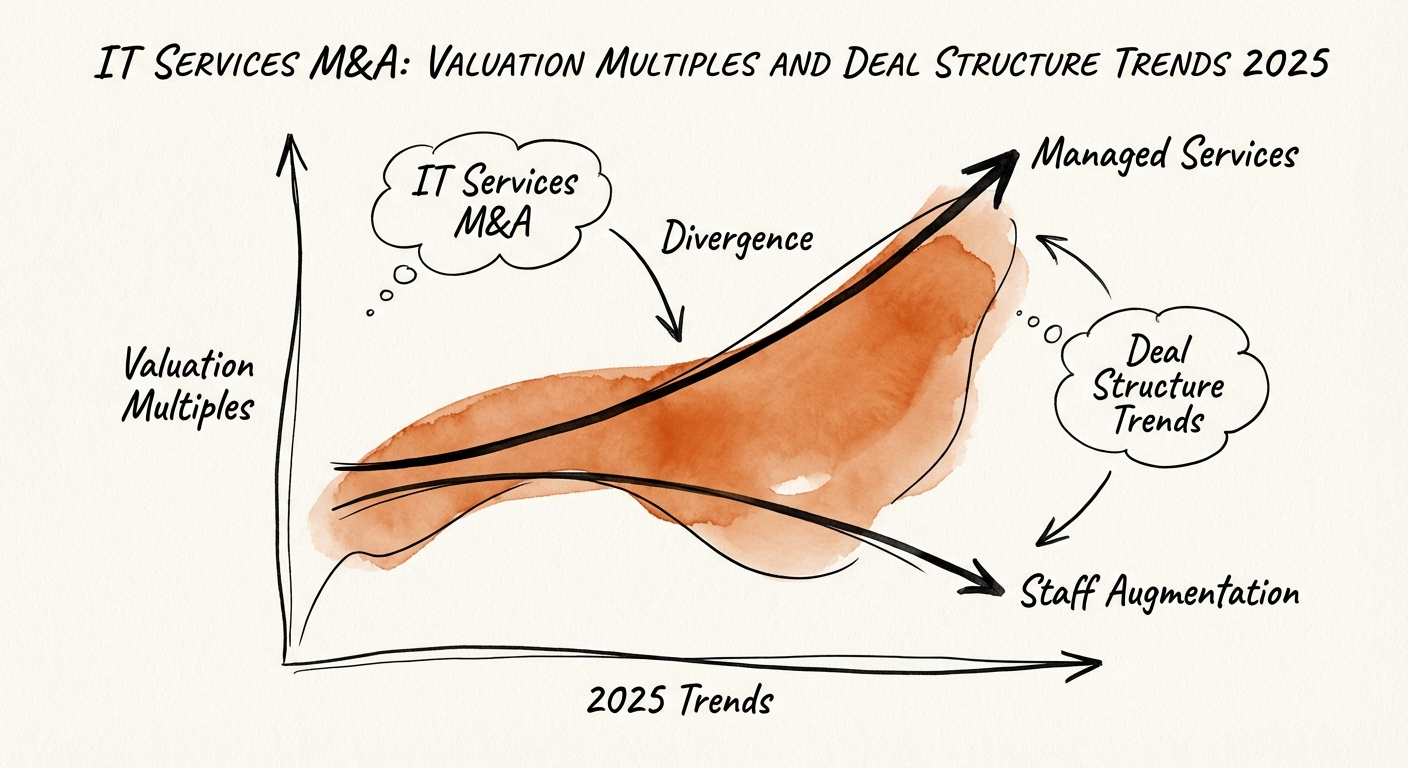
The Great Bifurcation: IT Services Valuation Multiples & Deal Trends 2025
2025 M&A Benchmarks: MSPs trading at 8.8x median, while premium assets hit 12.5x. New data on PE vs. Corporate valuations and earnout structures.
10.1x Avg PE Multiple vs. 8.6x Corp
BRIEF · MIGRATION & INTEGRATION
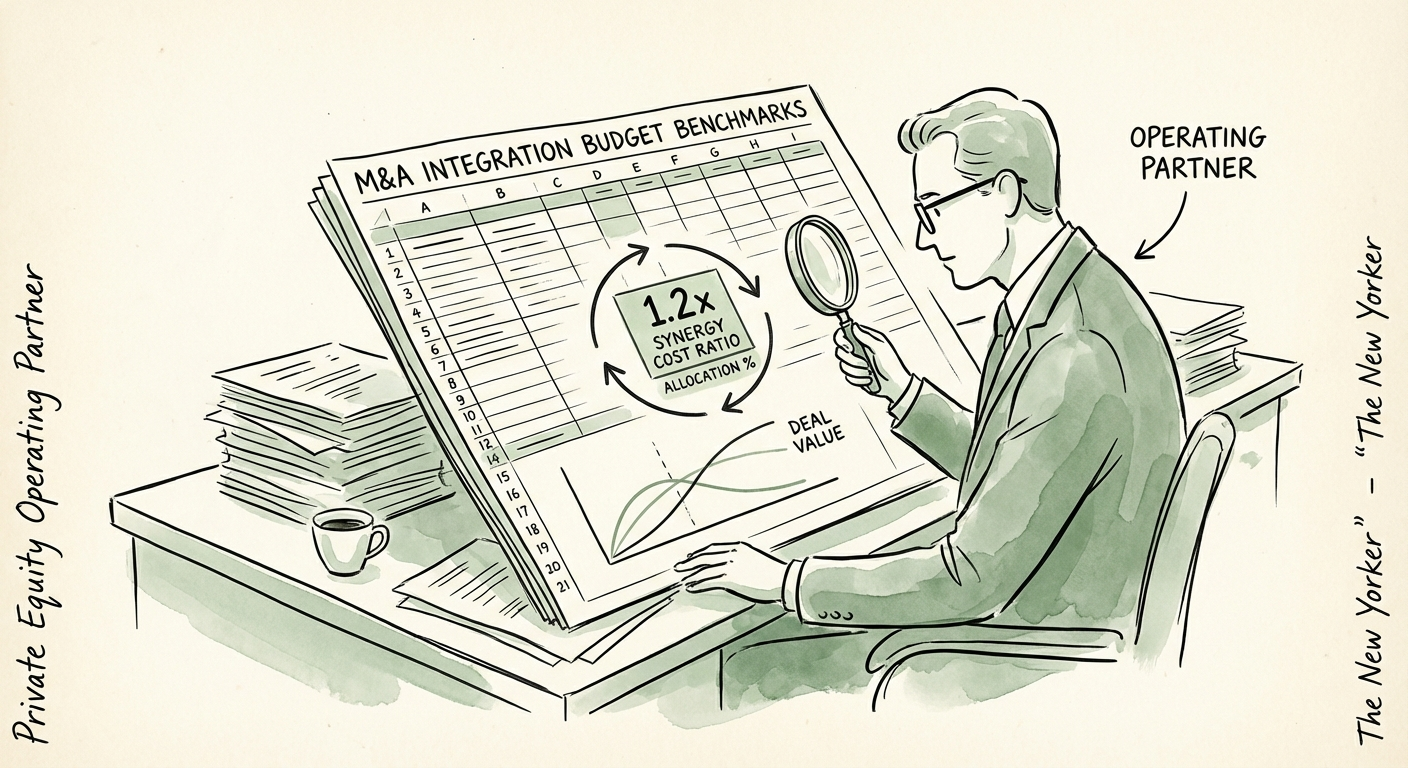
M&A Integration Budget Benchmarks: Why 3% of Deal Value Is a Trap
Benchmarks for M&A integration budgets: Why the standard 3% fails. Data shows real integration costs average 1.2x annual synergies or 5-10% of deal value.
1.2x One-Time Cost vs. Run-Rate Synergies
BRIEF · MIGRATION & INTEGRATION
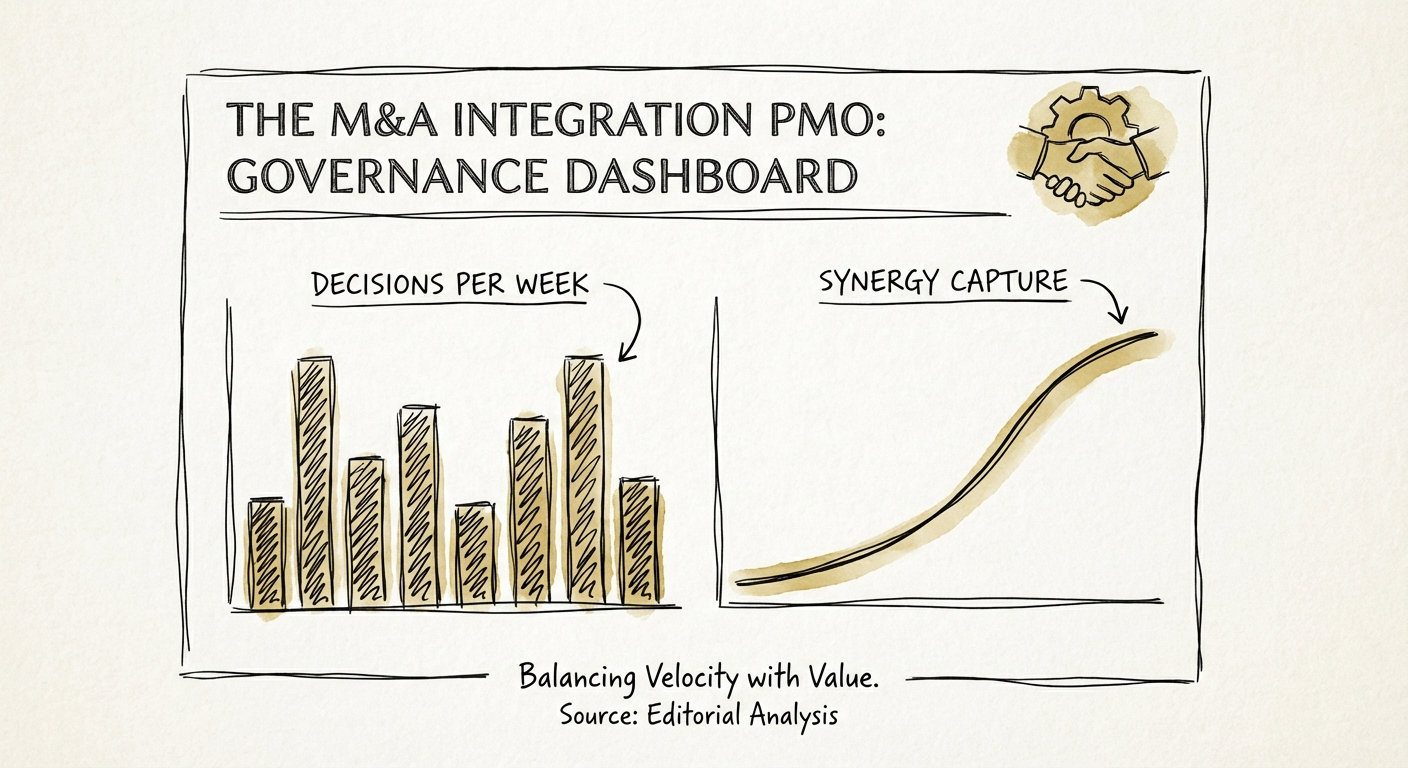
The M&A Integration PMO: What Good Governance Actually Looks Like
90% of deal value erosion happens during integration. Here is the M&A governance framework that shifts the PMO from 'reporting' to 'decision velocity' for PE operating partners.
90% Deal Value Erosion in PMI
BRIEF · MIGRATION & INTEGRATION
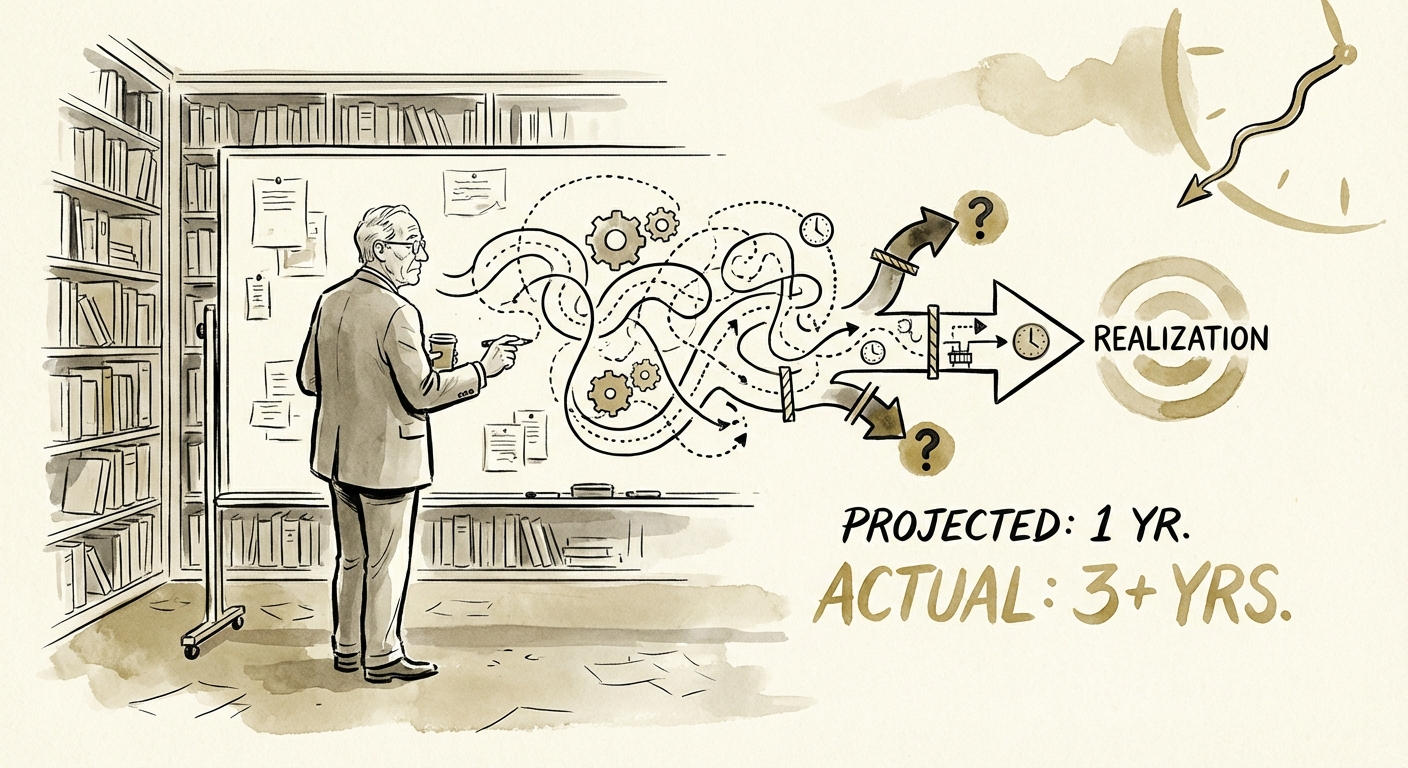
Why M&A Synergies Take 3x Longer to Realize Than Projected
See why M&A synergy realization slips from 12 months to 36+ months, where IT integration stalls, and how to reset post-close execution.
5.6 Years Median PE Hold Period (Historical High)
BRIEF · UNIT ECONOMICS
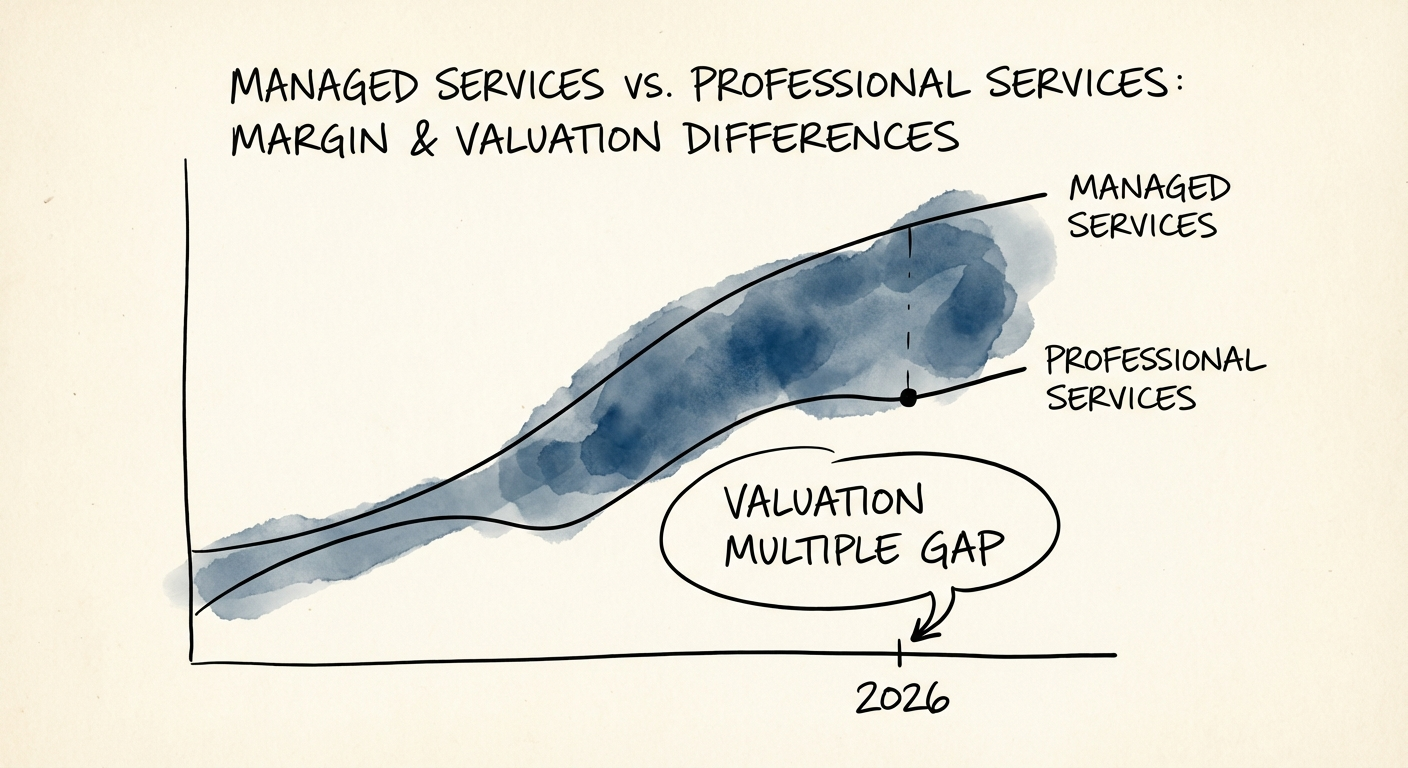
Why Your "Recurring Revenue" Trades at 5x When MSPs Get 11x
A $2M-EBITDA tech firm exits for $10M or $24M depending on one thing: whether its monthly revenue is a managed service or subscription labor. Here's the line.
3x Valuation Multiple Gap
BRIEF · EXIT READINESS
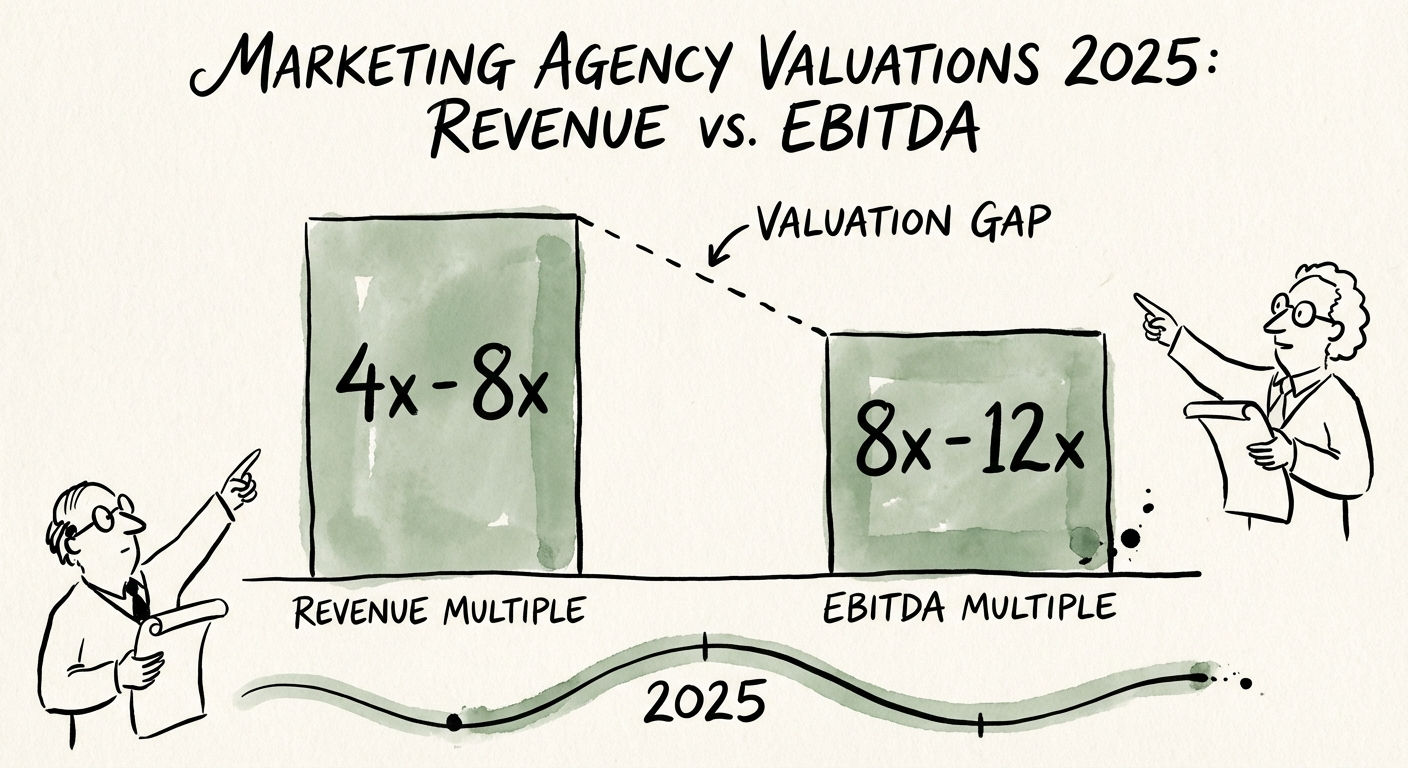
Marketing Agency Valuations: The Revenue Multiple Myth vs. The EBITDA Reality
Compare marketing agency revenue and EBITDA multiples, margin thresholds, and buyer discounts that separate scalable agencies from owner-led shops.
6.5x Median EBITDA Multiple (2025)
BRIEF · TEAM & HIRING
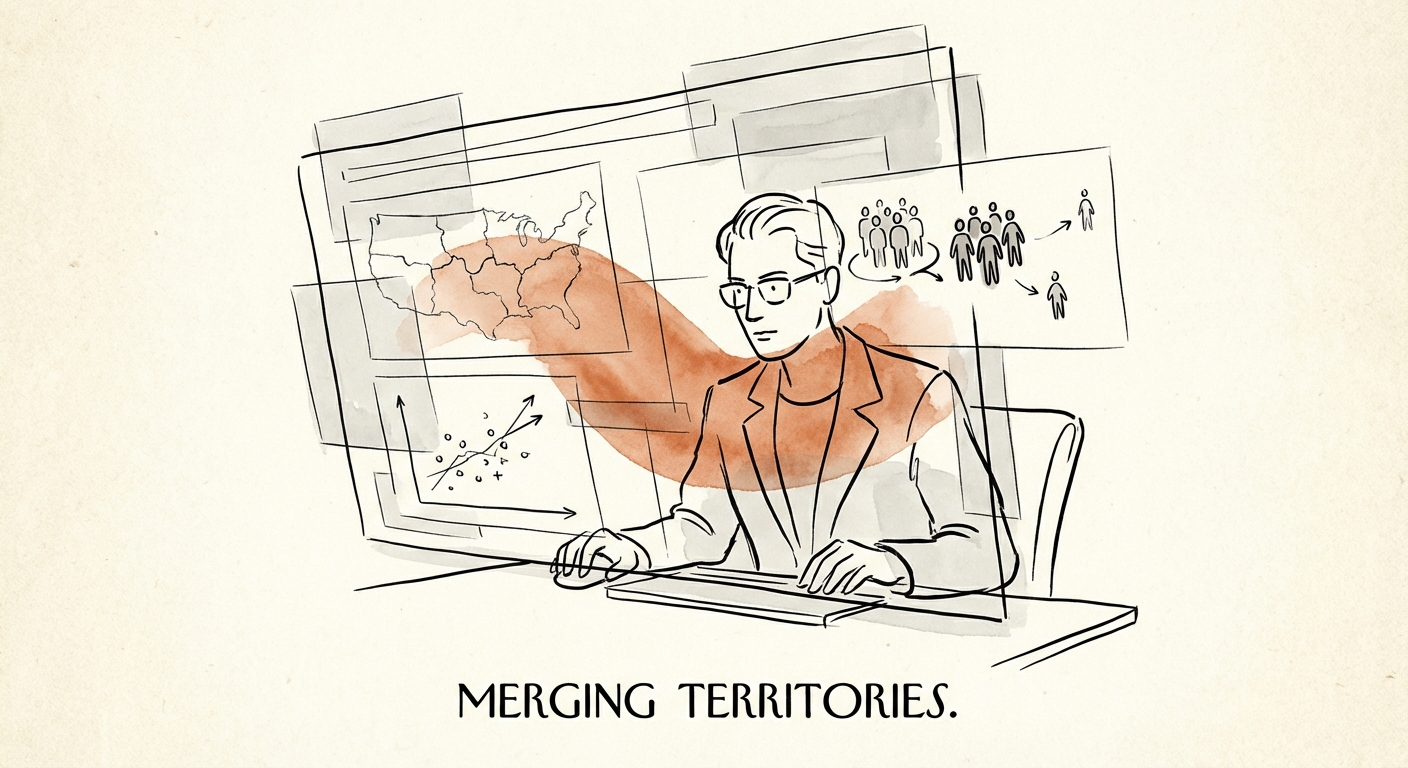
The Revenue Safety Valve: How to Merge Sales Teams Without Triggering a Mass Exodus
Post-merger sales turnover costs $150k per rep and kills deal thesis. Learn the 'Bridge Plan' methodology to merge territories without losing top talent.
15 Months Time to Full Productivity for New Hires
BRIEF · FINANCIAL INFRASTRUCTURE
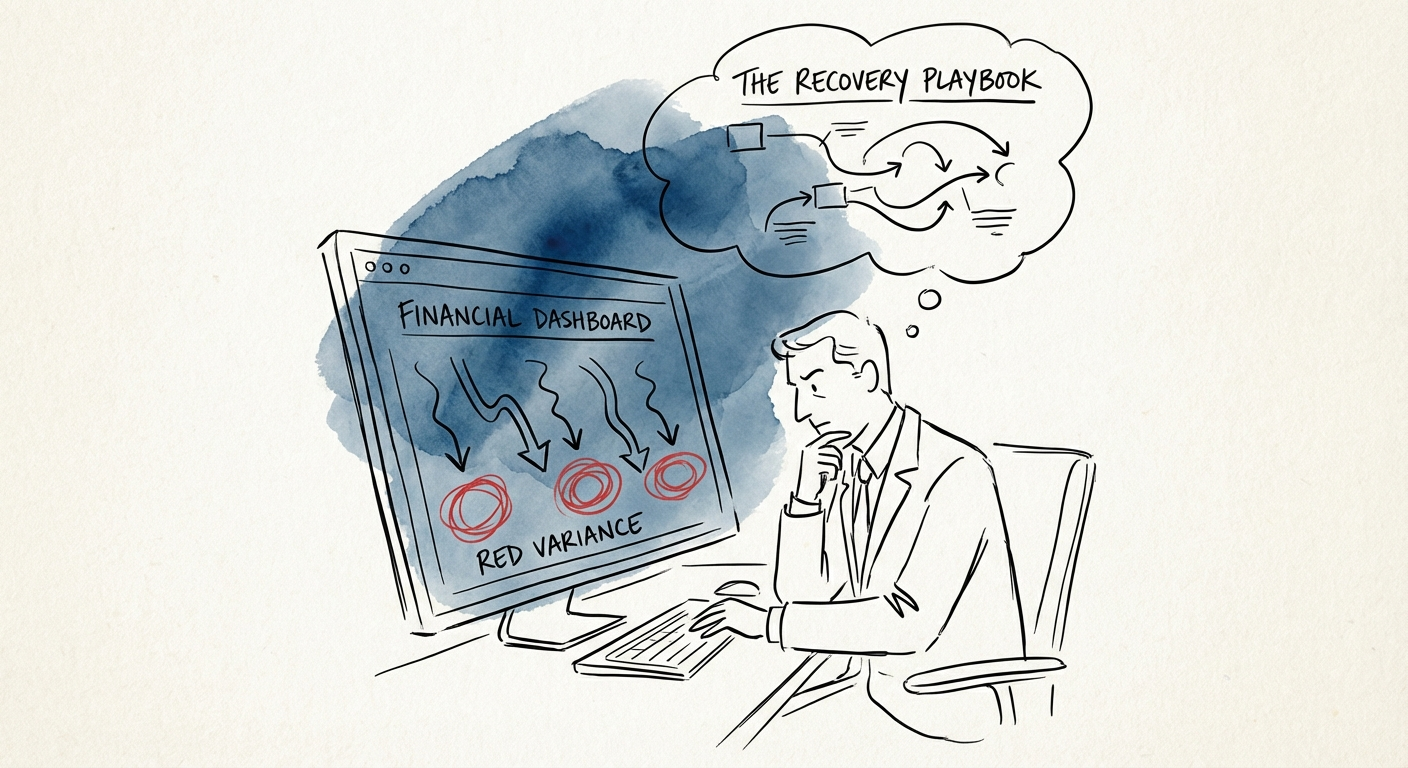
When Good Companies Have Bad Quarters: The Recovery Playbook
Only 7% of sales orgs forecast with >90% accuracy. When you miss a quarter, the problem isn't just revenue—it's infrastructure. Here is the 90-day recovery plan.
7% Forecast Accuracy >90%
BRIEF · FINANCIAL INFRASTRUCTURE
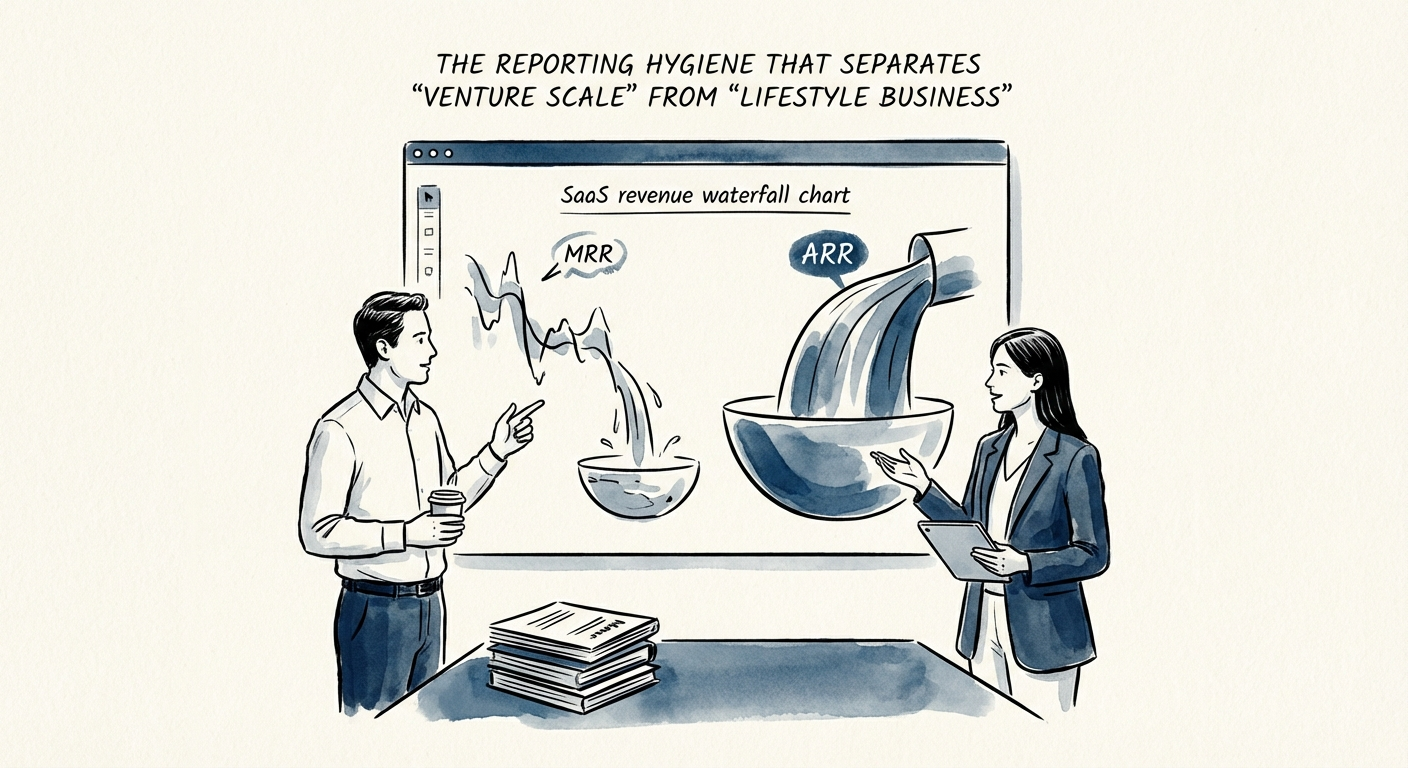
MRR vs. ARR: The Reporting Hygiene That Separates 'Venture Scale' from 'Lifestyle Business'
Stop conflating bookings with revenue. Clean MRR/ARR reporting commands a 31% valuation premium. Here is the operator's guide to audit-ready SaaS metrics.
31% Valuation Premium for Audit-Ready Financials
BRIEF · EXIT READINESS
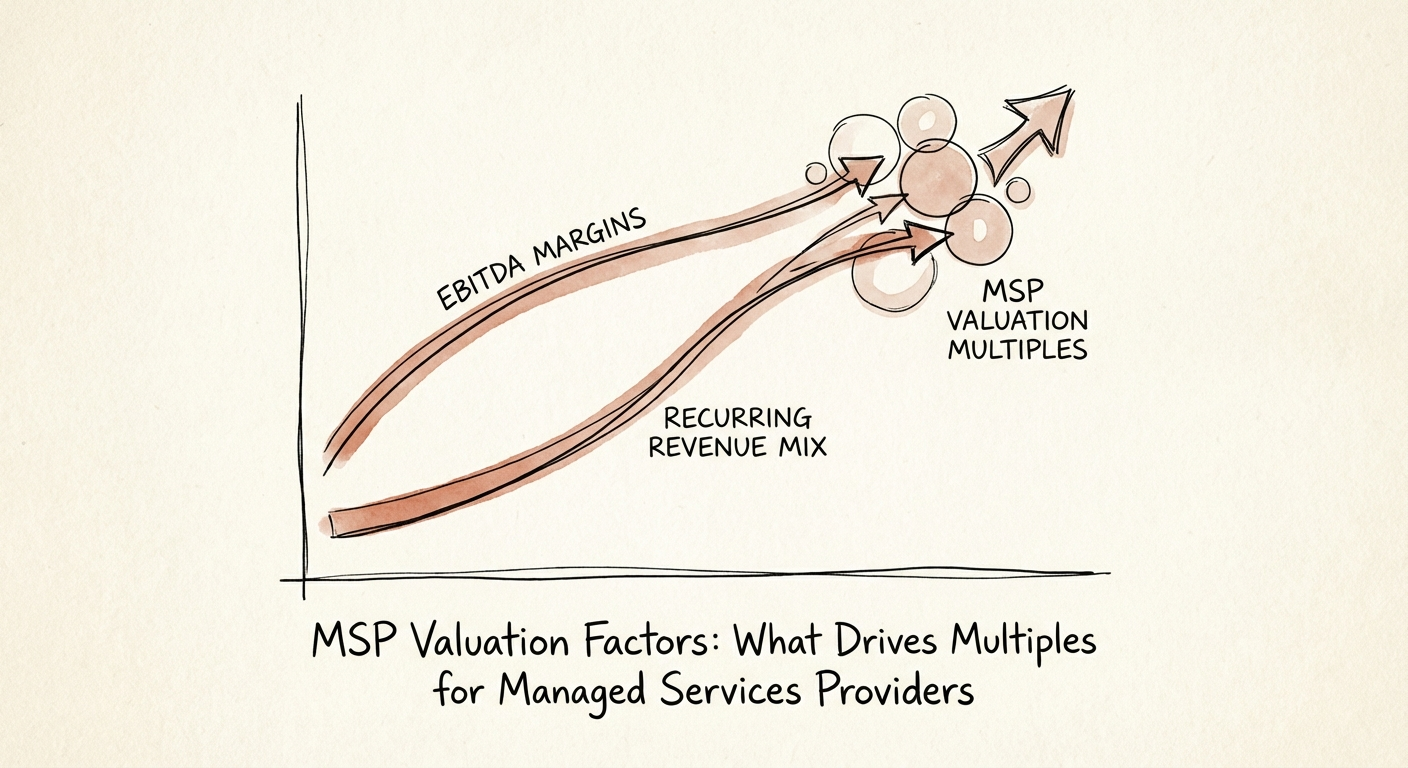
MSP Valuation Factors: Why Some Firms Trade at 10x and Others at 4x
New 2025 data: Average MSPs trade at 5-6x EBITDA, while best-in-class firms hit 10x+. Learn the 4 specific metrics that bridge the gap.
19% Best-in-Class EBITDA Margin
BRIEF · MIGRATION & INTEGRATION
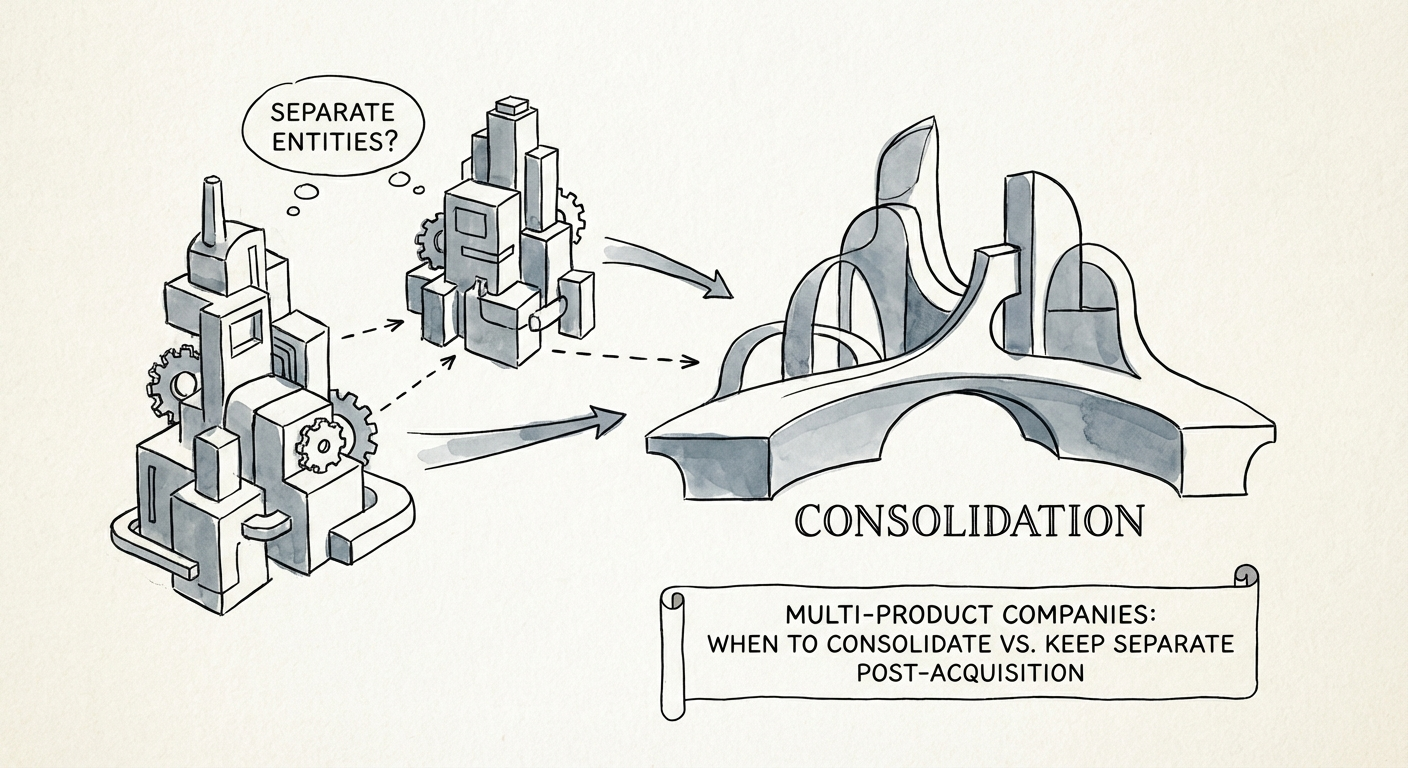
The Platform Paradox: When to Consolidate Tech Stacks (And When to Leave Them Alone)
80% of tech M&A deals are now 'scope' plays. Here is the PE Operating Partner's diagnostic for when to consolidate tech stacks vs. keeping them separate.
80% Tech Deals Classified as 'Scope' Plays
BRIEF · REVENUE ARCHITECTURE
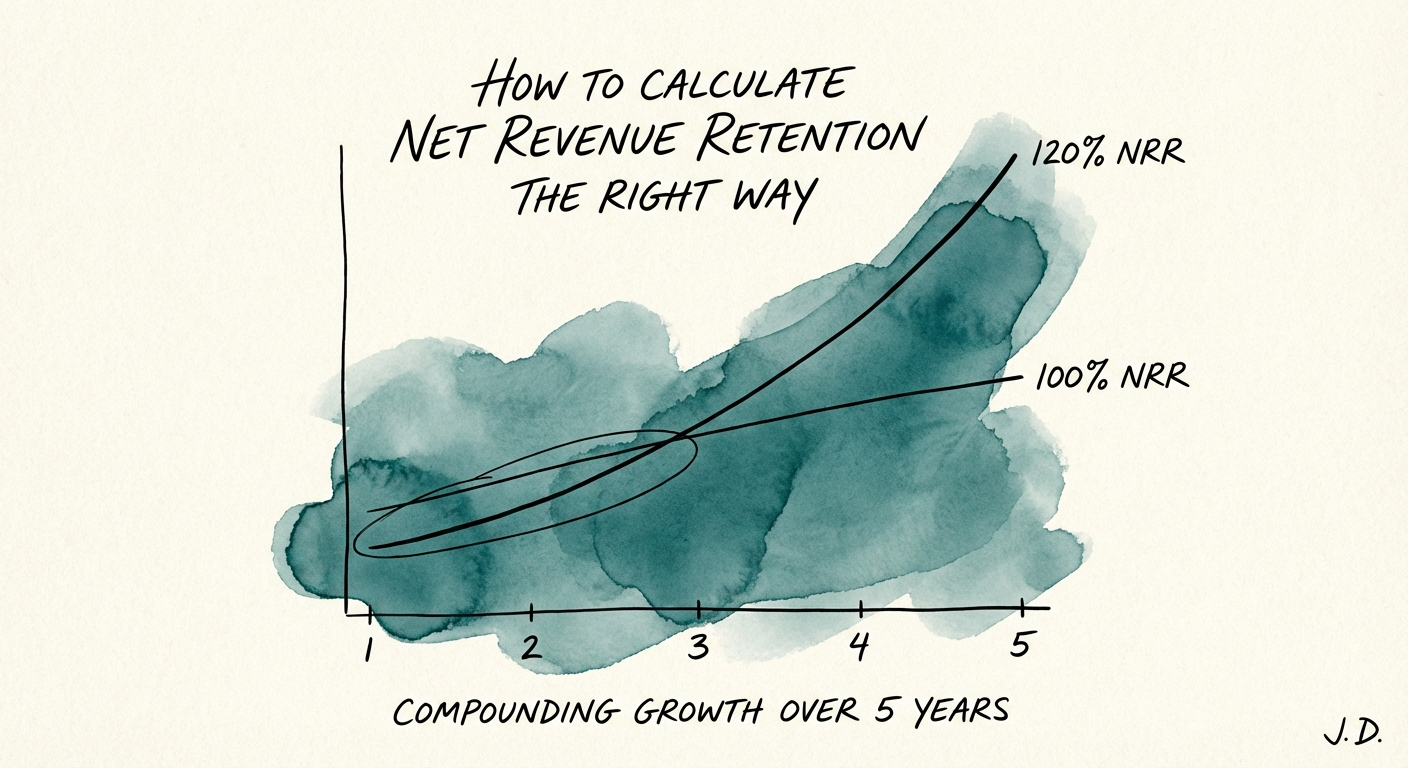
The Valuation Multiplier: How to Calculate Net Revenue Retention the Right Way
Stop calculating NRR wrong. Learn the exact Net Revenue Retention formula PE firms use, 2025 benchmarks for Series B/C, and why 120% NRR drives a 63% valuation premium.
63% Valuation Premium for Top-Quartile NRR
BRIEF · REVENUE ARCHITECTURE
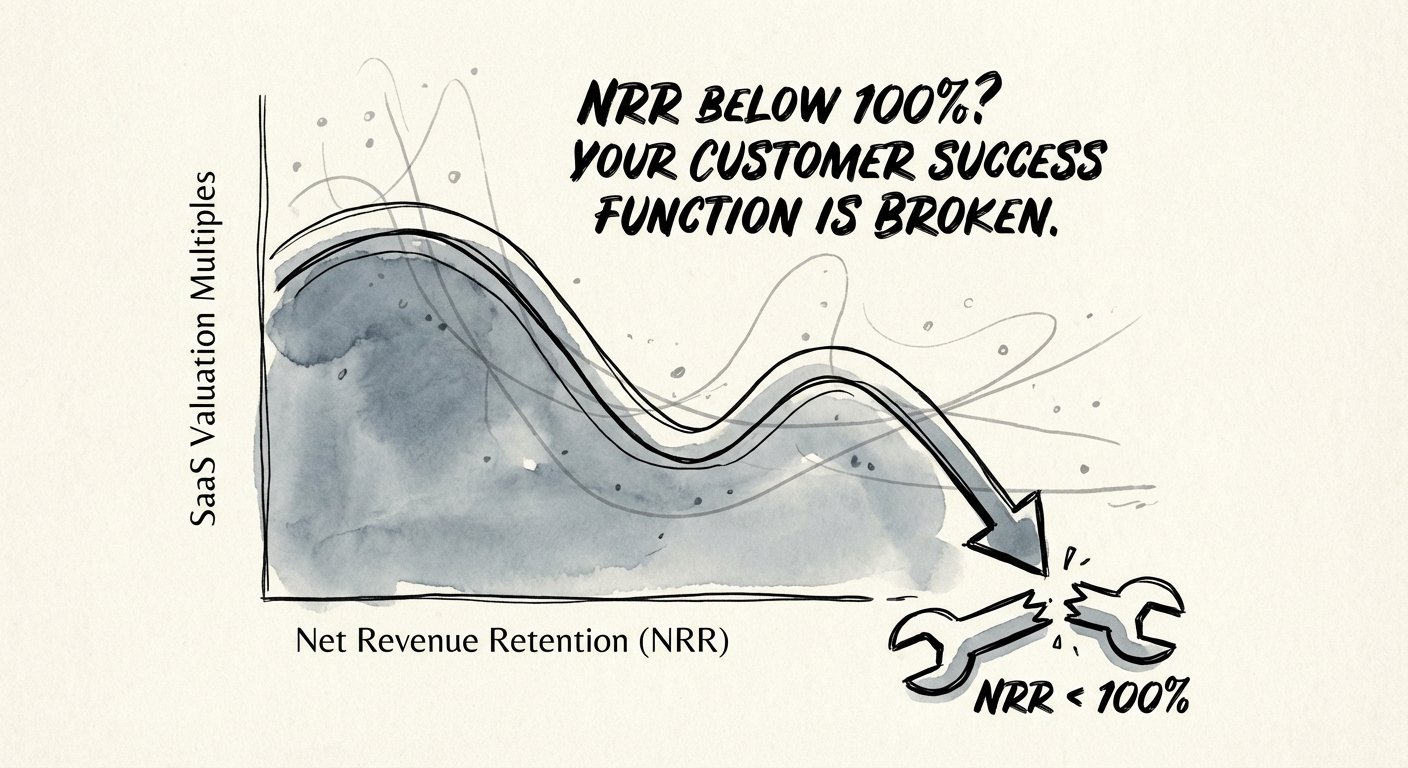
NRR Below 100%? Your Customer Success Function Is Broken
Companies with <100% NRR trade at a 46% valuation discount. Here is the diagnostic playbook to fix your Customer Success function and restore net growth.
3x Valuation Multiplier Gap
BRIEF · EXIT READINESS
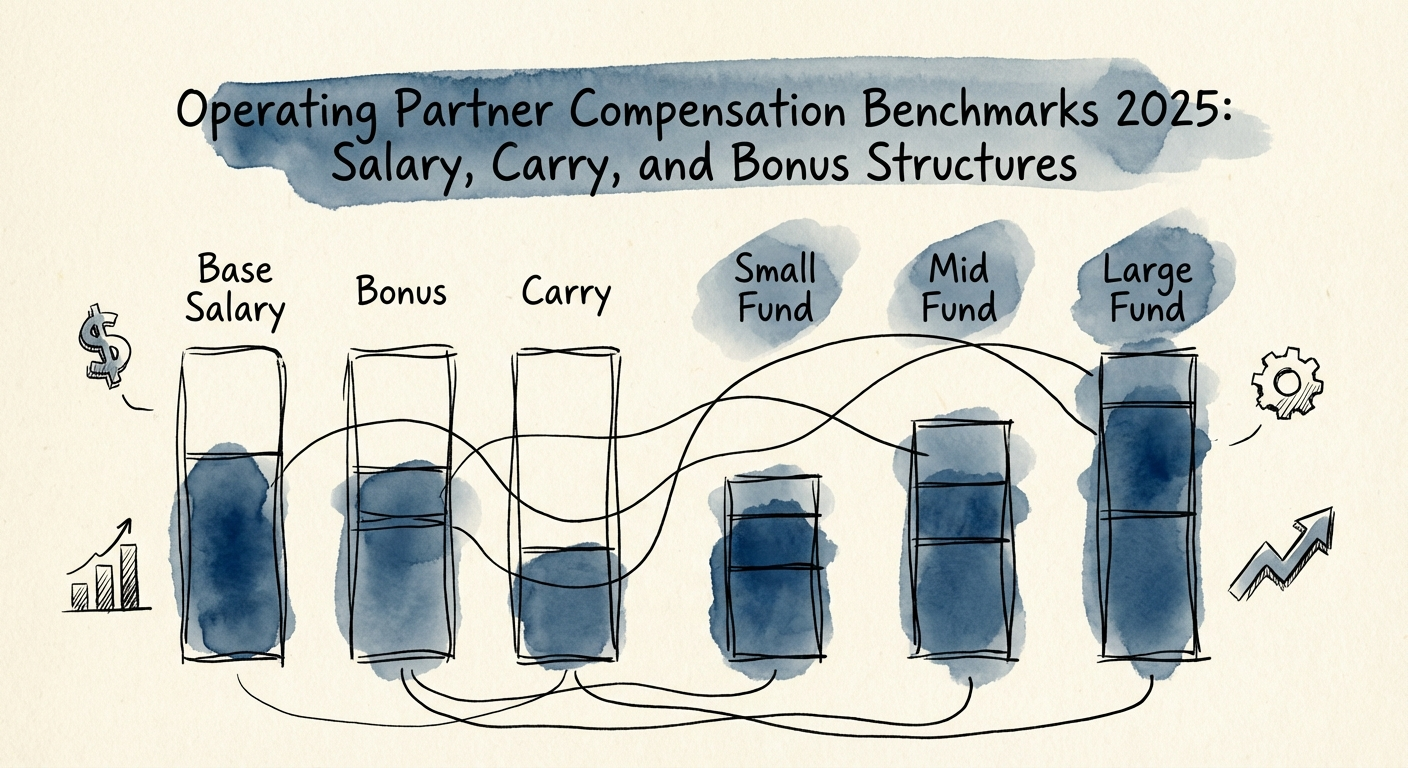
Operating Partner Compensation Benchmarks 2025: Are You Paid Like a Consultant or a Principal?
See 2025 operating partner compensation benchmarks: salary ranges, bonus structure, carry points, and the consultant-versus-principal economics gap.
70-85% Pay Parity vs. Deal Partners
BRIEF · EXIT READINESS
Operating Partner Red Flags: 10 Signs Your Portfolio Company Is in Trouble
Median hold periods have hit 6.5 years. If your portfolio company shows these 10 red flags, you need to intervene before the exit window closes.
6.5 Years Median Hold Period
BRIEF · TECHNICAL DEBT
The Operating Partner's Guide to Technology Decisions: Why "Tech Debt" is Just Financial Debt in Disguise
Technical debt consumes 40% of IT budgets in 2025. Learn how PE Operating Partners can quantify and remediate this hidden EBITDA killer.
40% of IT Budgets Consumed by Tech Debt
BRIEF · EXIT READINESS
The Operational Due Diligence Questionnaire: 75 Questions to Ask Before the Buyer Does
A 75-point operational due diligence checklist for PE Operating Partners. Uncover deal killers in revenue, tech debt, and cyber before the buyer does. Reduce deal failure risk.
60% Buyers Who Walk Due to Cyber Risks

BRIEF · EXIT READINESS
The Operational Audit: 12 Questions PE Firms Ask to Expose Hidden Risk
Don't let operational red flags kill your deal. These 12 due diligence questions reveal the hidden risks in tech and services firms. 31% of codebases fail this test.
31% Acquired Codebases with Critical Debt
BRIEF · EXIT READINESS
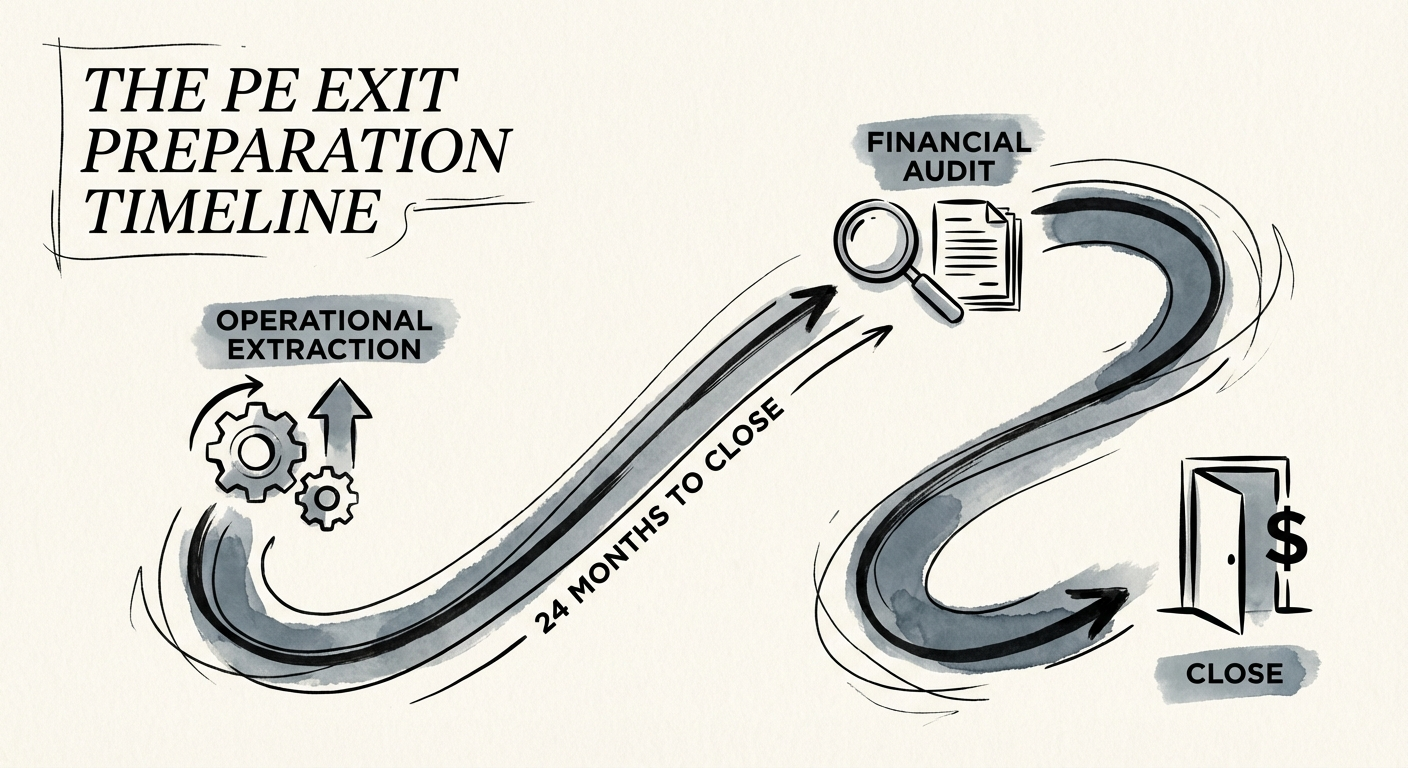
The PE Exit Preparation Timeline: 24 Months to Close
Standard exits take 6 months; successful ones take 24. A diagnostic timeline for founders to fix operations, clear due diligence, and secure a 5-10% valuation premium.
30% Faster Deal Closure
BRIEF · TEAM & HIRING
The Human Diligence Gap: Why 73% of Your Portfolio CEOs Won't Survive the Hold Period
73% of portfolio company CEOs are replaced during the hold period. Stop relying on 'gut feel' due diligence. Here is the operator's framework for assessing management team quality before you buy.
73% CEO Turnover Rate
BRIEF · TEAM & HIRING
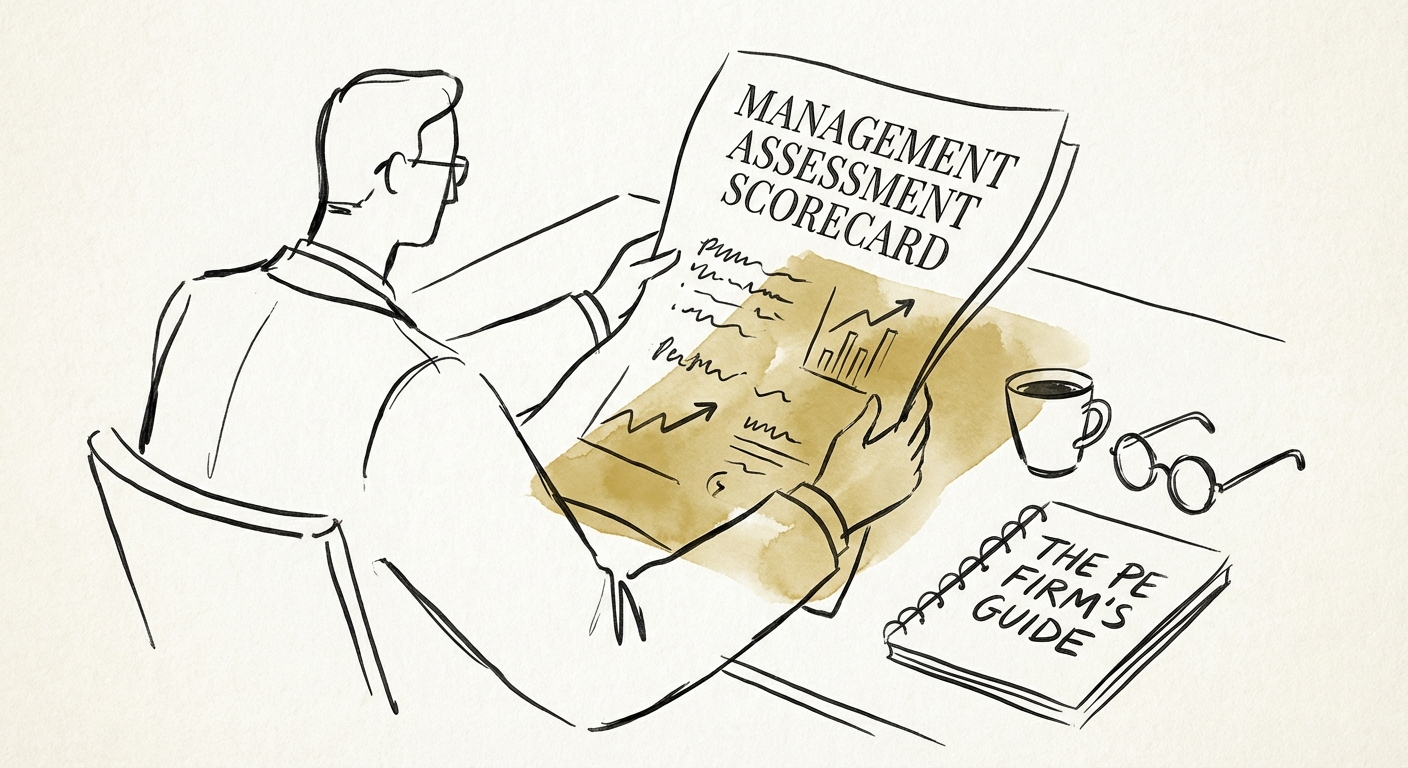
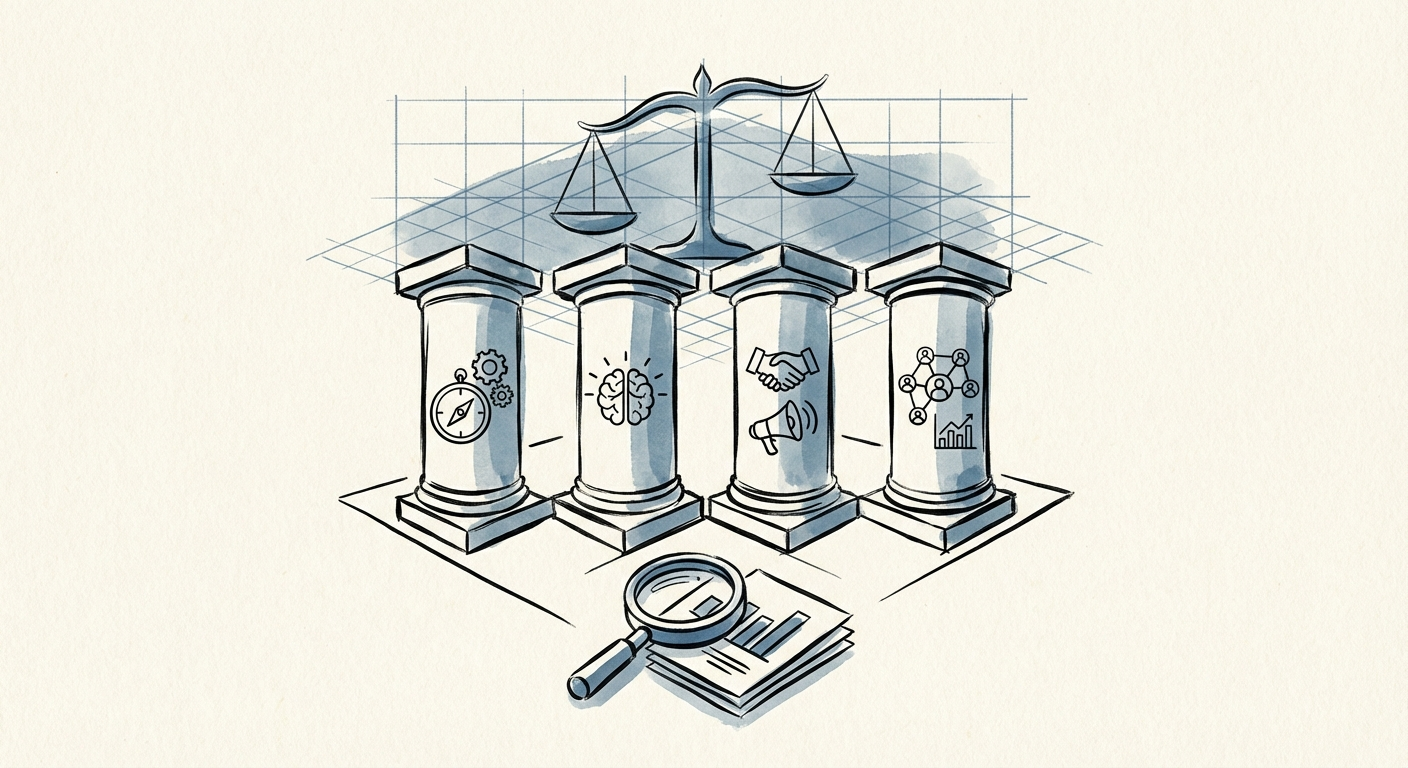
The Human Capital Audit: A Quantitative Framework for PE Management Assessment
73% of portfolio CEOs are replaced during the hold period. Stop relying on 'gut feel.' Use this quantitative Management Assessment Framework to de-risk your next acquisition.
73% CEO Replacement Rate
BRIEF · FINANCIAL INFRASTRUCTURE
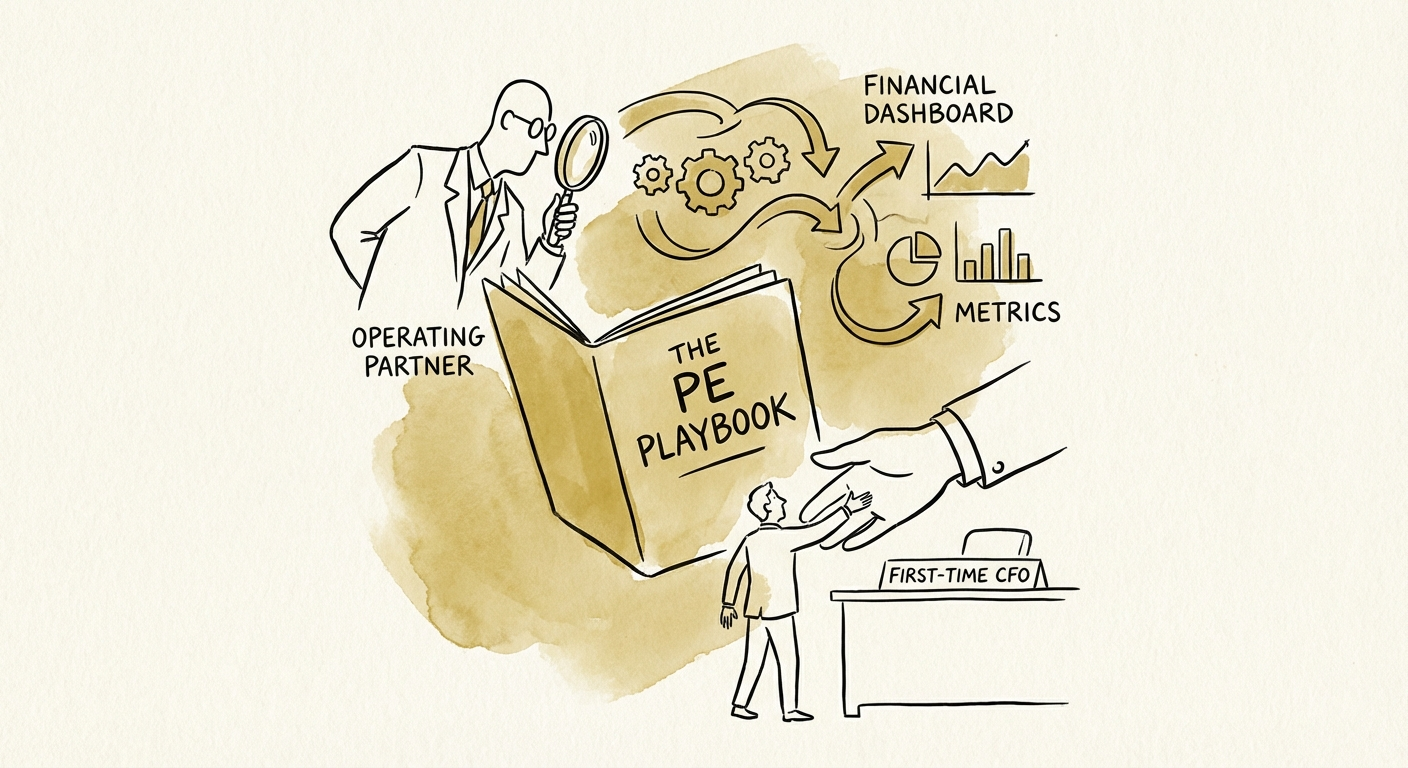
The PE Playbook for Installing a First-Time CFO
80% of PE portfolio CFOs are replaced during the hold period. Here is the playbook for installing a finance leader who speaks fluent EBITDA.
80% Replacement Rate