BRIEF · EXIT READINESS
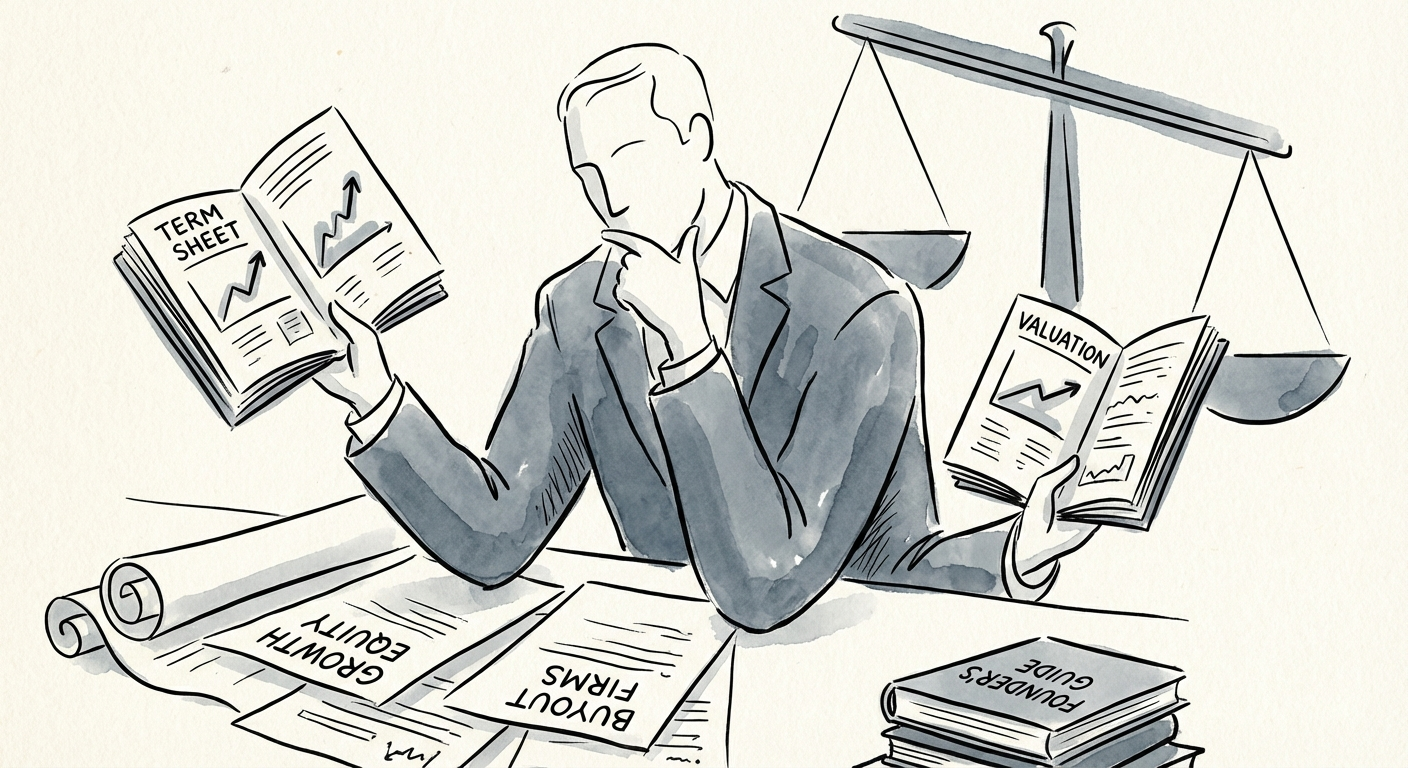
Growth Equity vs. Buyout: The Term-Sheet Question That Decides Whether You Stay CEO
Growth equity or buyout? The real divide is control, not check size. 2025 hold periods, the 11.7x NRR multiple, and the rollover math founders miss.
5.8 Years Median PE Hold Period (2025)
BRIEF · COMPLIANCE & SECURITY
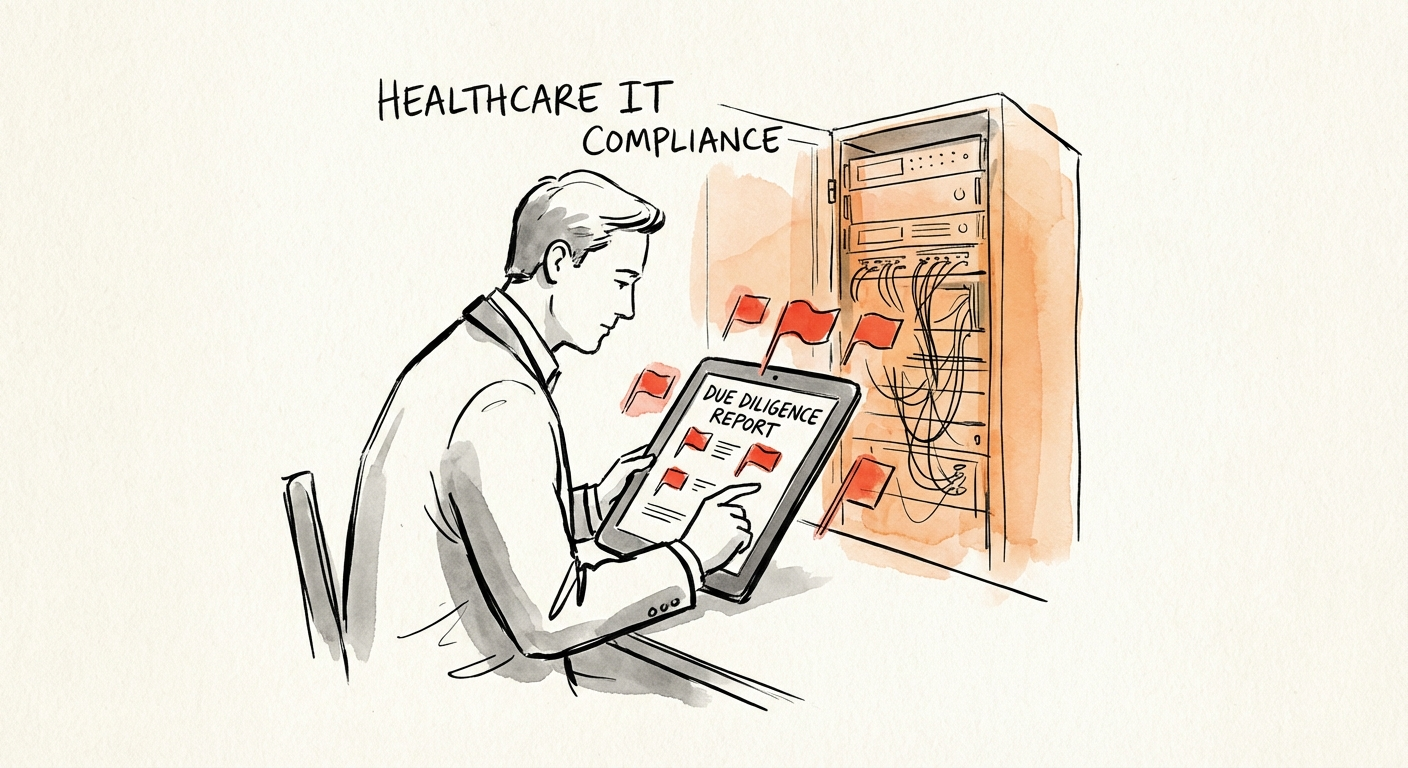
Healthcare IT Due Diligence: Why the SOC 2 Report Lies and the Database Tells the Truth
A clean HIPAA binder hides a $9.77M breach risk. The exact technical checks PE buyers must run on a healthcare IT target before they wire the funds.
$9.77M Avg. Healthcare Breach Cost
BRIEF · UNIT ECONOMICS
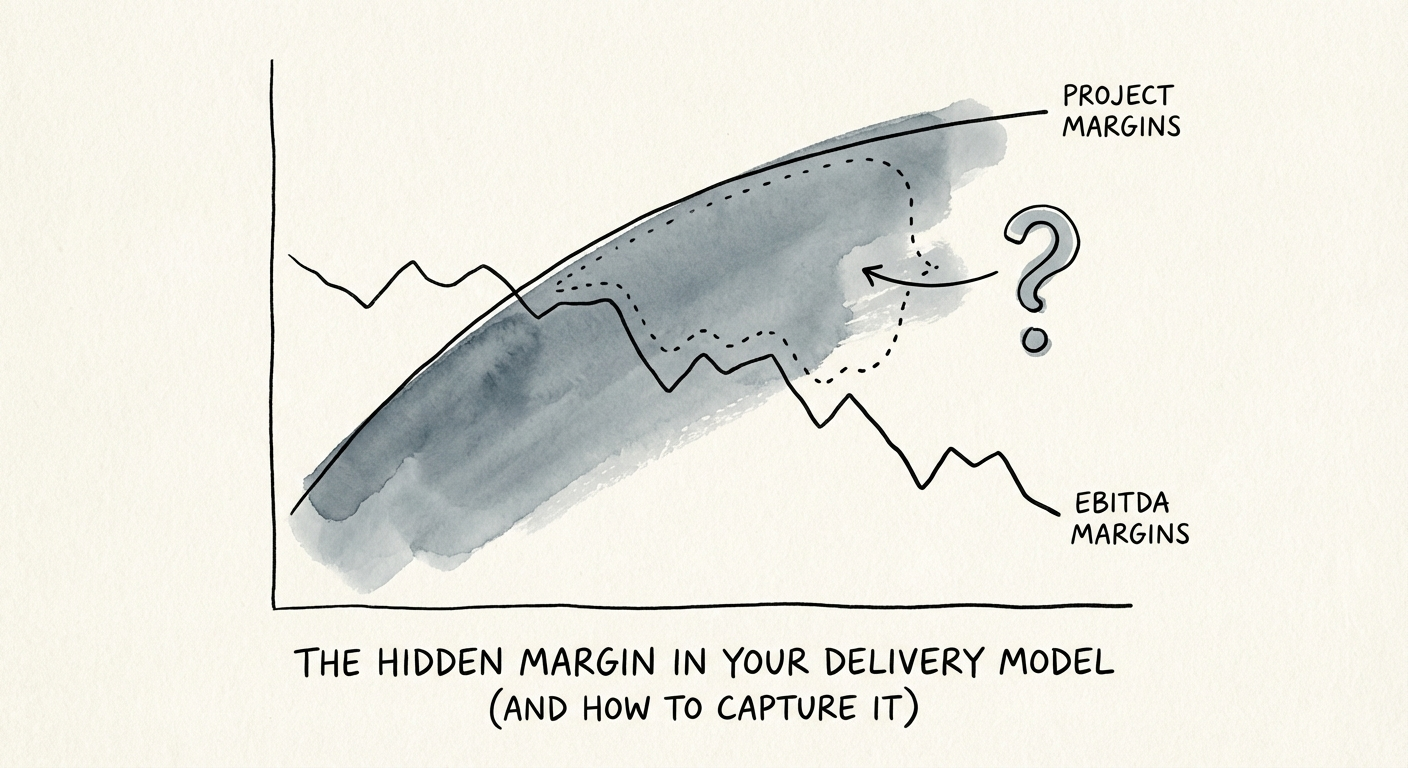
The 'Hidden' Margin in Your Delivery Model: Why You're Bleeding 26% of Your Revenue
New 2025 data shows EBITDA margins hitting a decade low of 9.8% despite stable project margins. Here is the diagnostic framework to recapture lost profitability.
9.8% Median EBITDA Margin (2025)
BRIEF · TEAM & HIRING
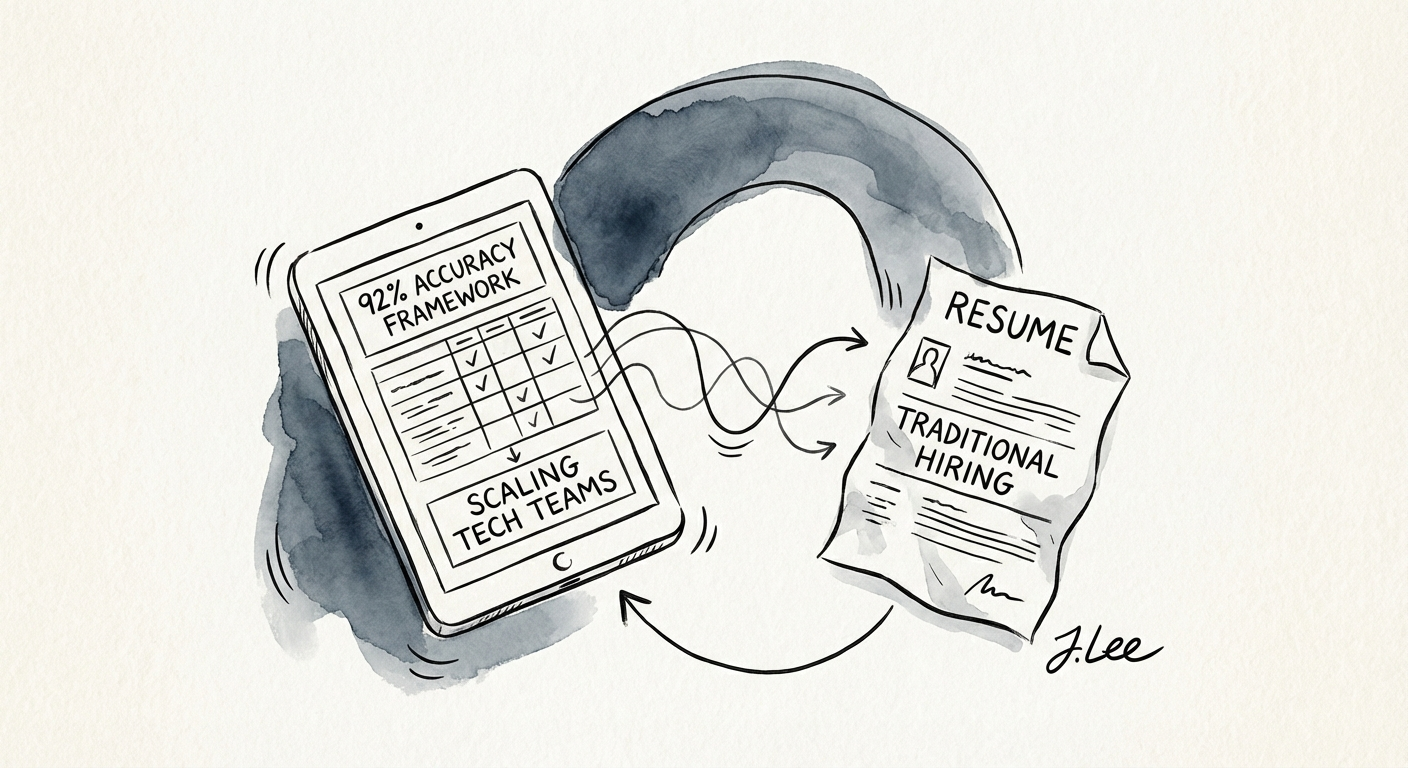
How Series B Founders Stop Being the Chief Interviewer (and Hire at 92% Accuracy)
Series B/C founders interview 12 hours a week and still mis-hire senior engineers at $240k a pop. Here's the scorecard-and-veto system that gets you out of the loop.
$240,000 Cost of One Bad Senior Engineer Hire
BRIEF · TECHNICAL DEBT
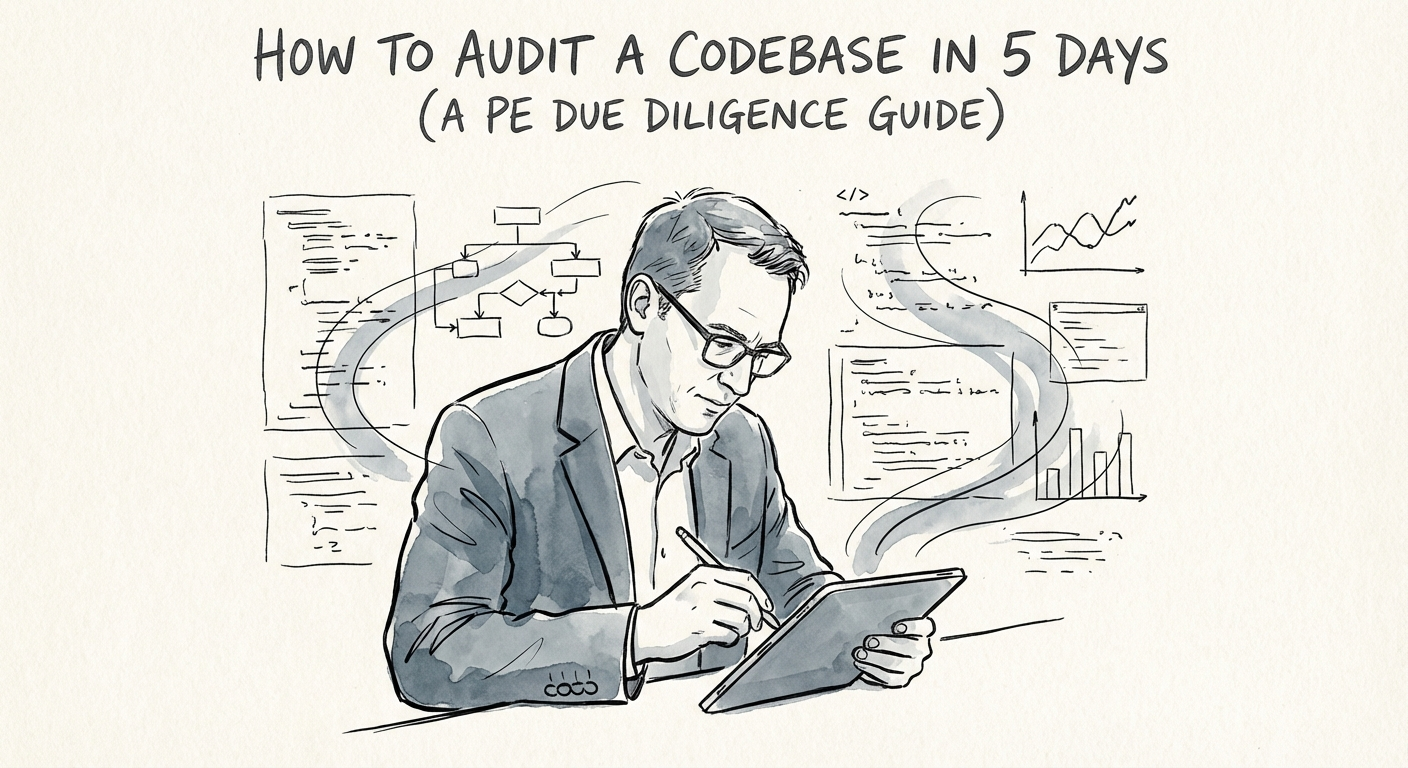
How to Audit a Codebase in 5 Days (A PE Due Diligence Guide)
74% of commercial codebases contain high-risk vulnerabilities. Learn the 5-day technical due diligence process to uncover hidden debt before you sign.
74% Codebases with High-Risk Vulnerabilities
BRIEF · EXIT READINESS
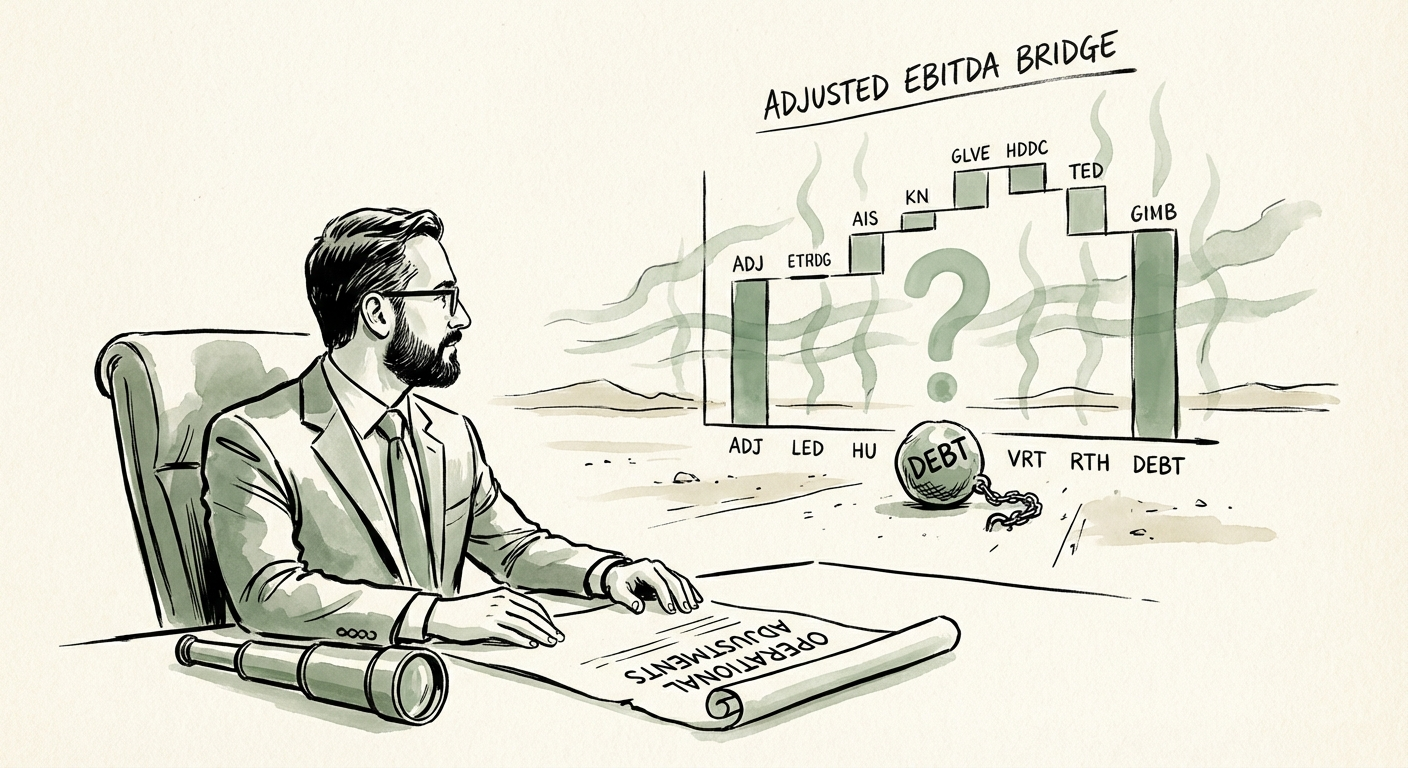
The $5M EBITDA That's Really $3.2M: Reading a Services Firm's Earnings Before You Overpay
A QoE report verifies what was spent. It misses what the founder isn't paying for. Here's how to recalculate a services firm's Adjusted EBITDA before you sign.
9.4x Lower Middle Market EBITDA Multiple (Q3 2025)
BRIEF · UNIT ECONOMICS
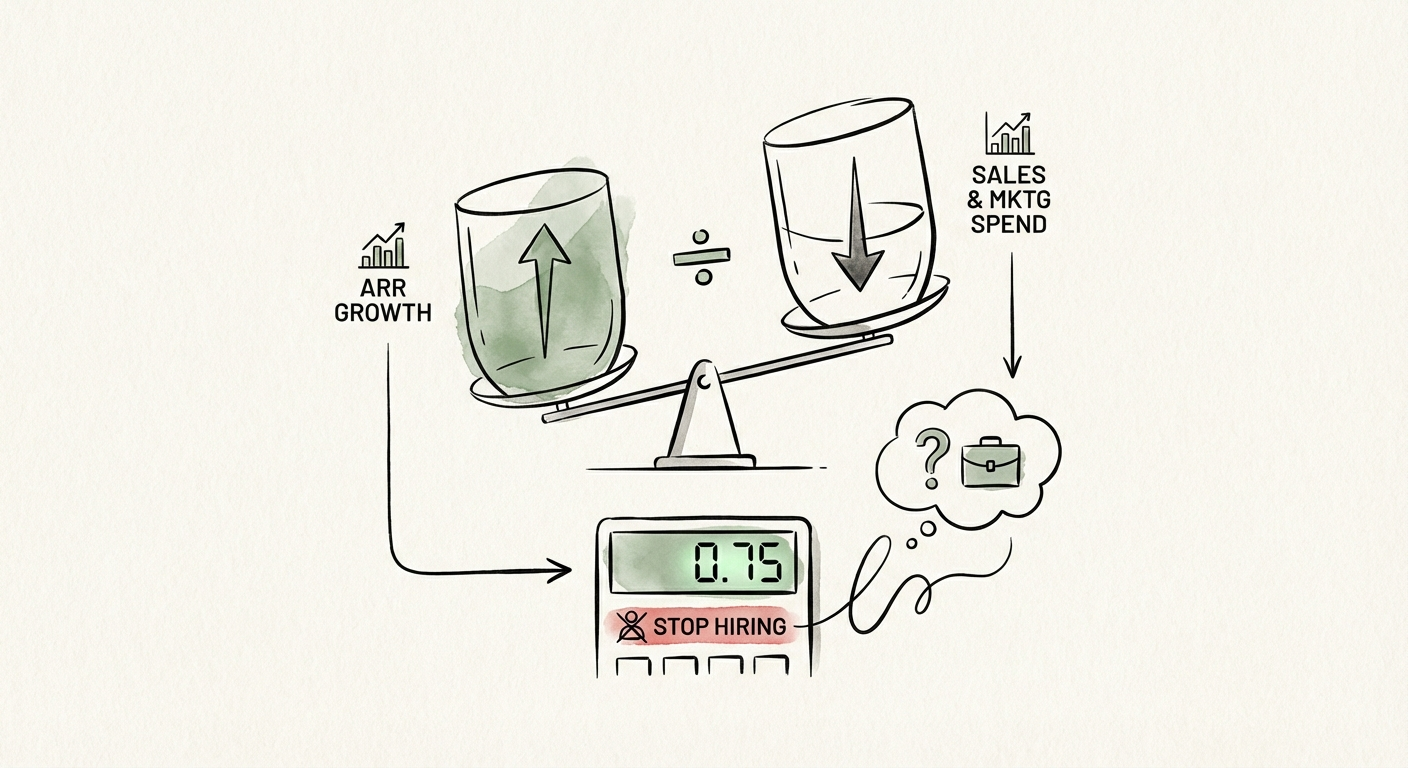
The SaaS Magic Number Calculator: Why < 0.75 Means You Stop Hiring
The SaaS Magic Number isn't just a VC metric—it's your hiring signal. Learn the formula, 2025 benchmarks (target >0.75), and why dropping below 0.5 demands an immediate hiring freeze.
0.75 The 2025 Efficiency Floor
BRIEF · TECHNICAL DEBT
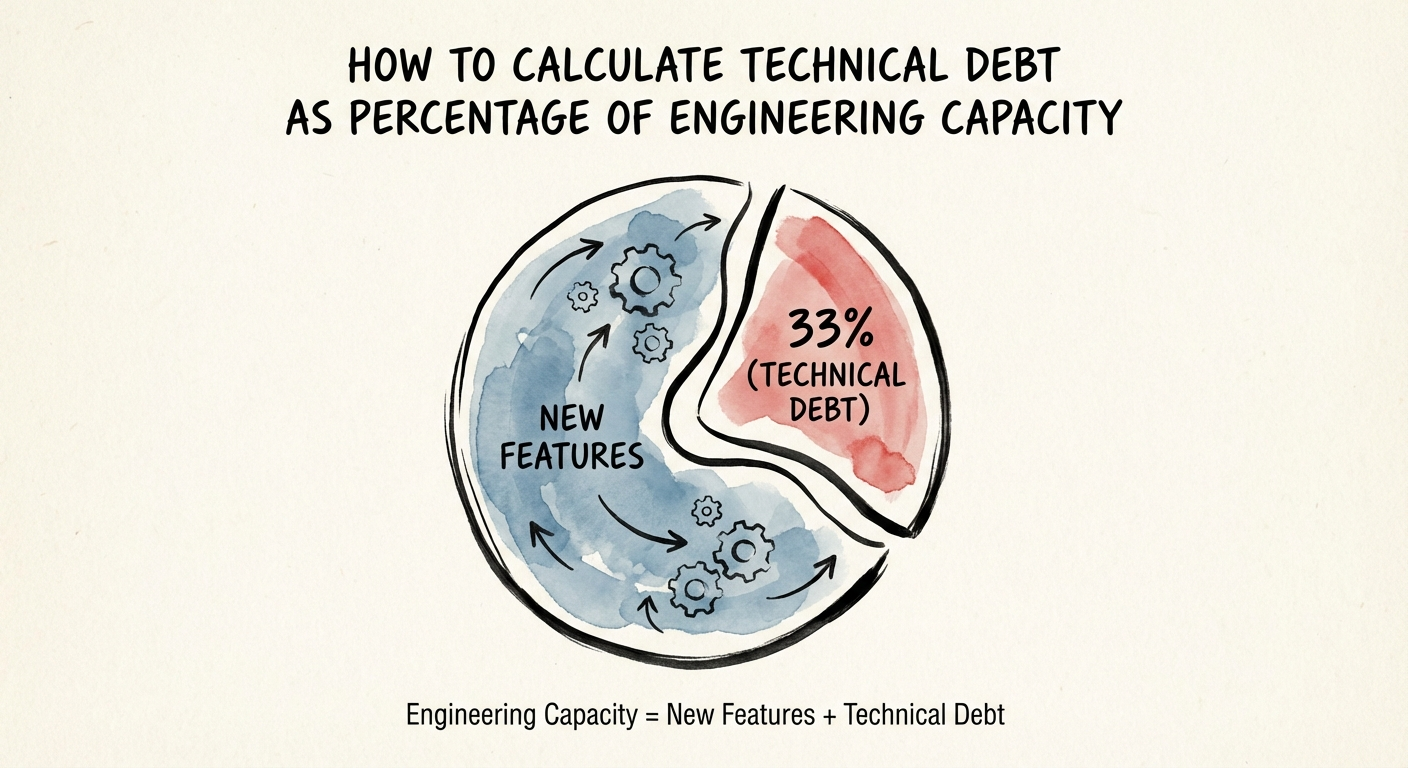
You Doubled Engineering and Velocity Barely Moved: Calculating Tech Debt as a Share of Capacity
You went from 15 to 30 engineers and shipped 20% more. Here's the issue-tracker math that turns "the code is messy" into a board-ready capacity number.
33% Avg. Capacity Lost to Debt
BRIEF · TECHNICAL DEBT
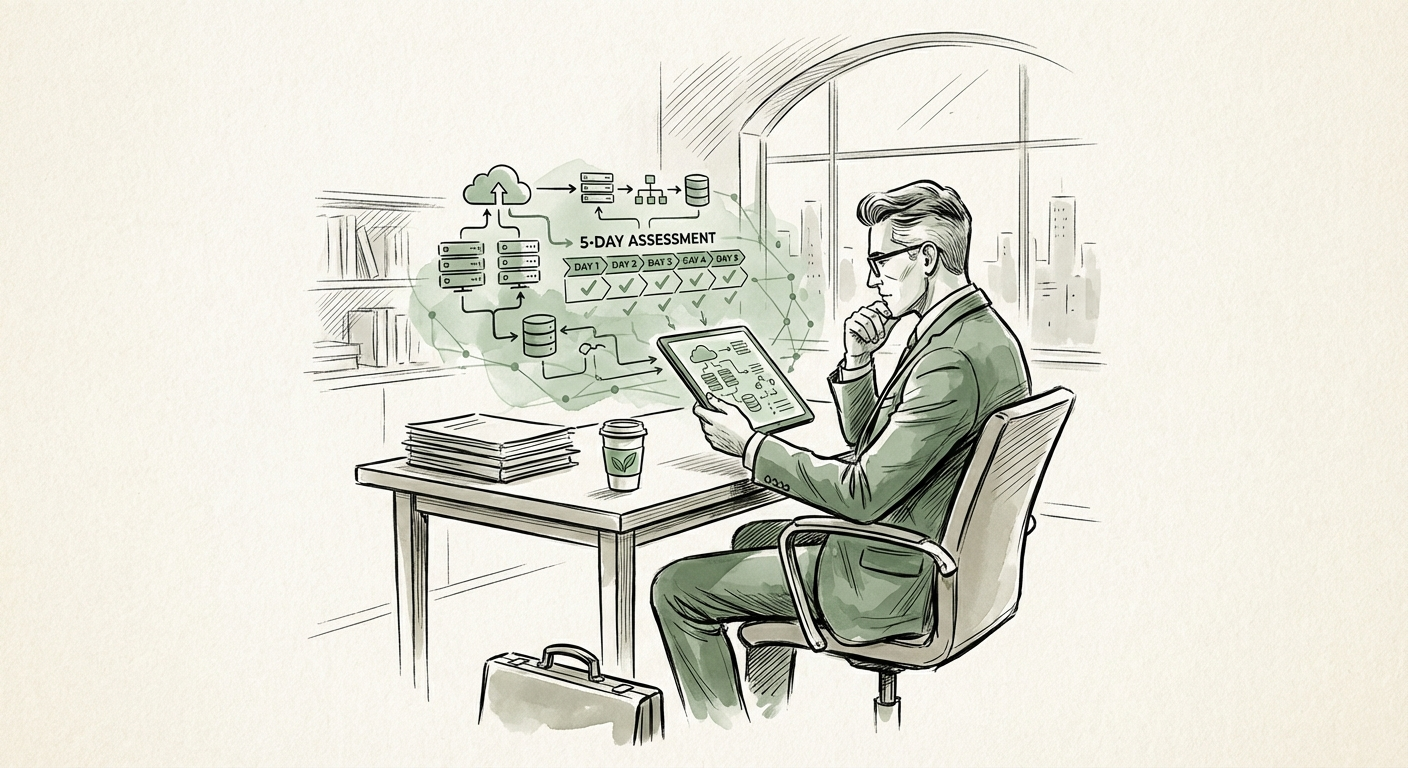
How to Conduct a 5-Day Technical Due Diligence Assessment
Standard tech due diligence takes 12 weeks. Our 5-day 'Code-to-Cash' assessment uncovers the 20-40% of hidden technical debt before you sign the LOI.
76% Tech Acquisition Failure Rate
BRIEF · EXIT READINESS
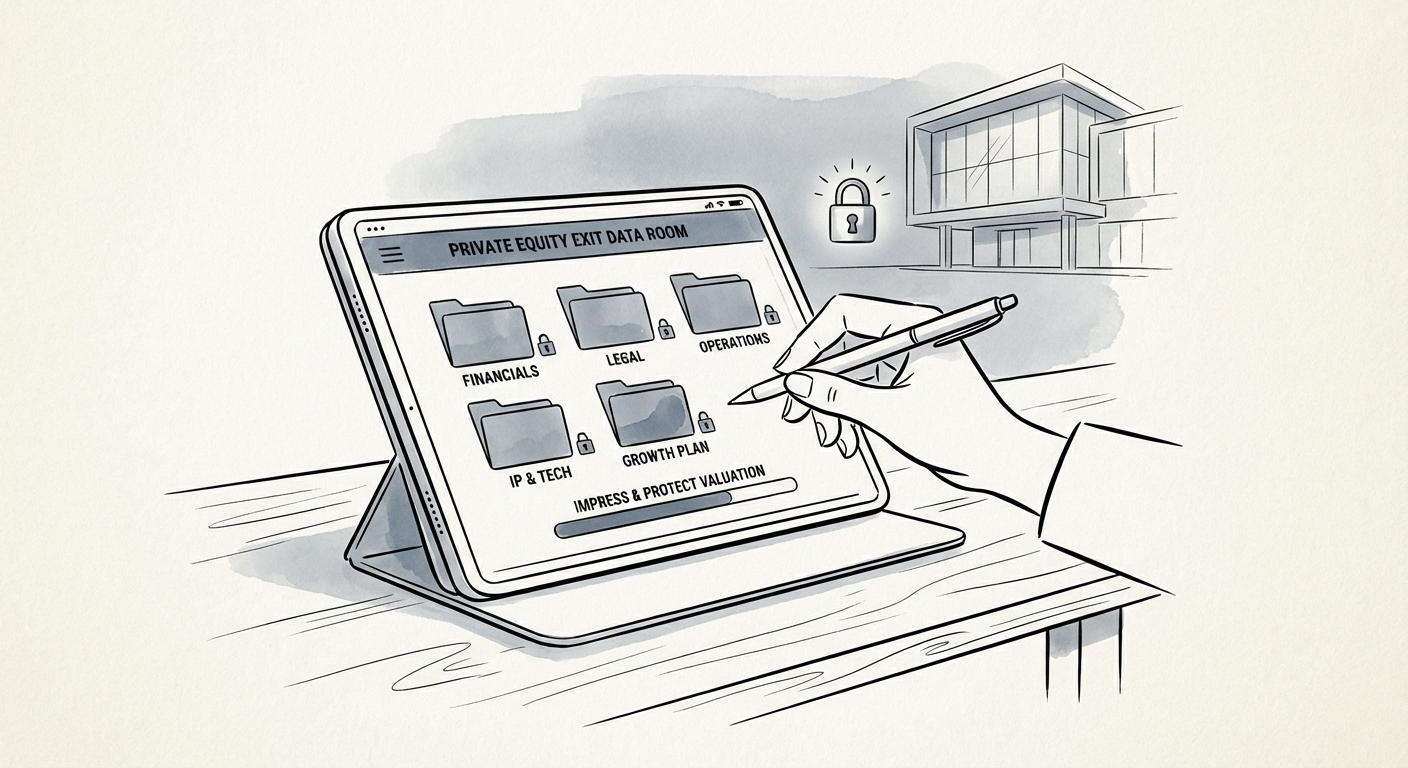
How to Create a Data Room That Impresses PE Buyers (And Protects Your Valuation)
35% of deals stall due to poor data rooms. Learn the 2026 PE standard for Virtual Data Rooms (VDRs) to avoid re-trading and close 40% faster.
35% Deal Delay Probability
BRIEF · EXIT READINESS
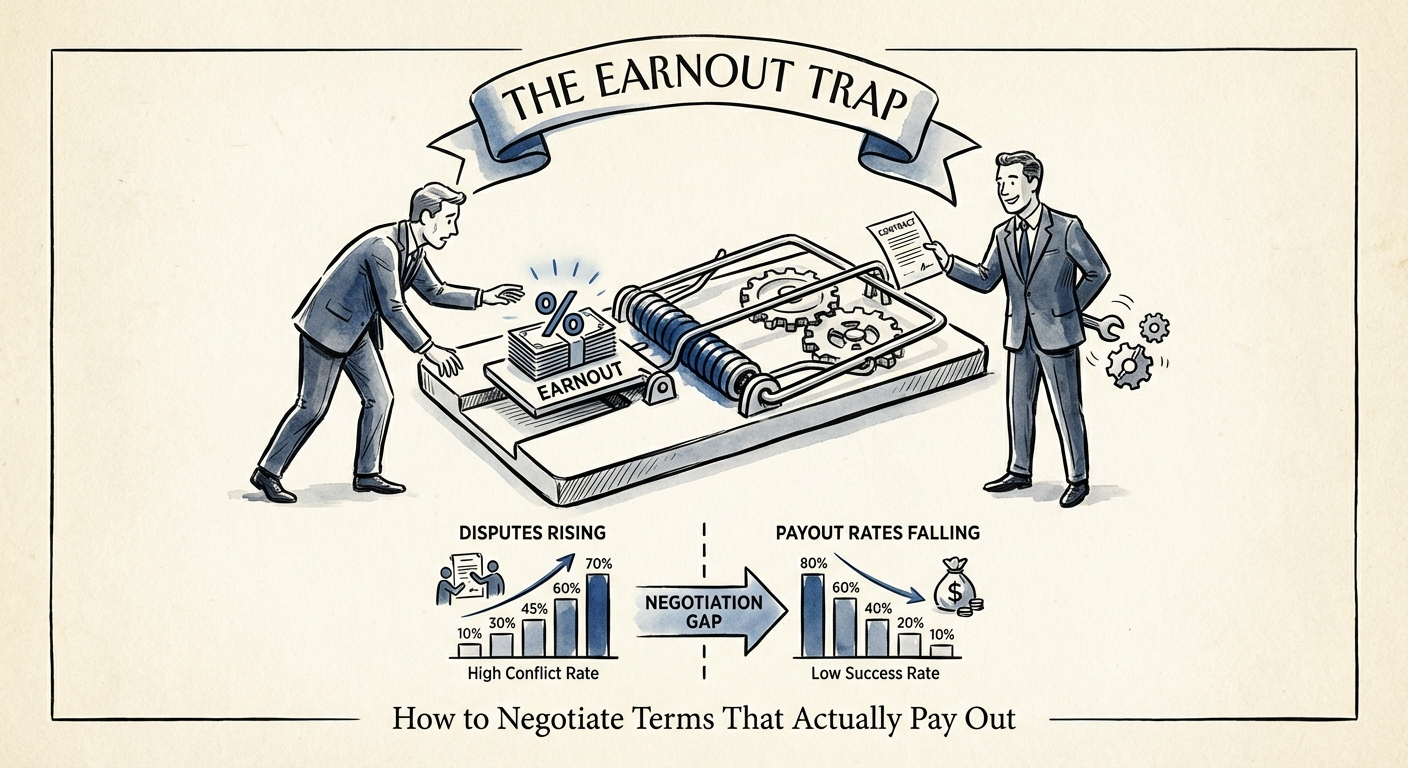
Earnouts in Tech Deals: How to Win the 79 Cents Buyers Plan to Keep
The average earnout pays 21 cents on the dollar. For founders selling a B2B tech company, here is how the metric, the term, and three clauses decide your check.
21¢ Avg. Earnout Payout per $1
BRIEF · FINANCIAL INFRASTRUCTURE
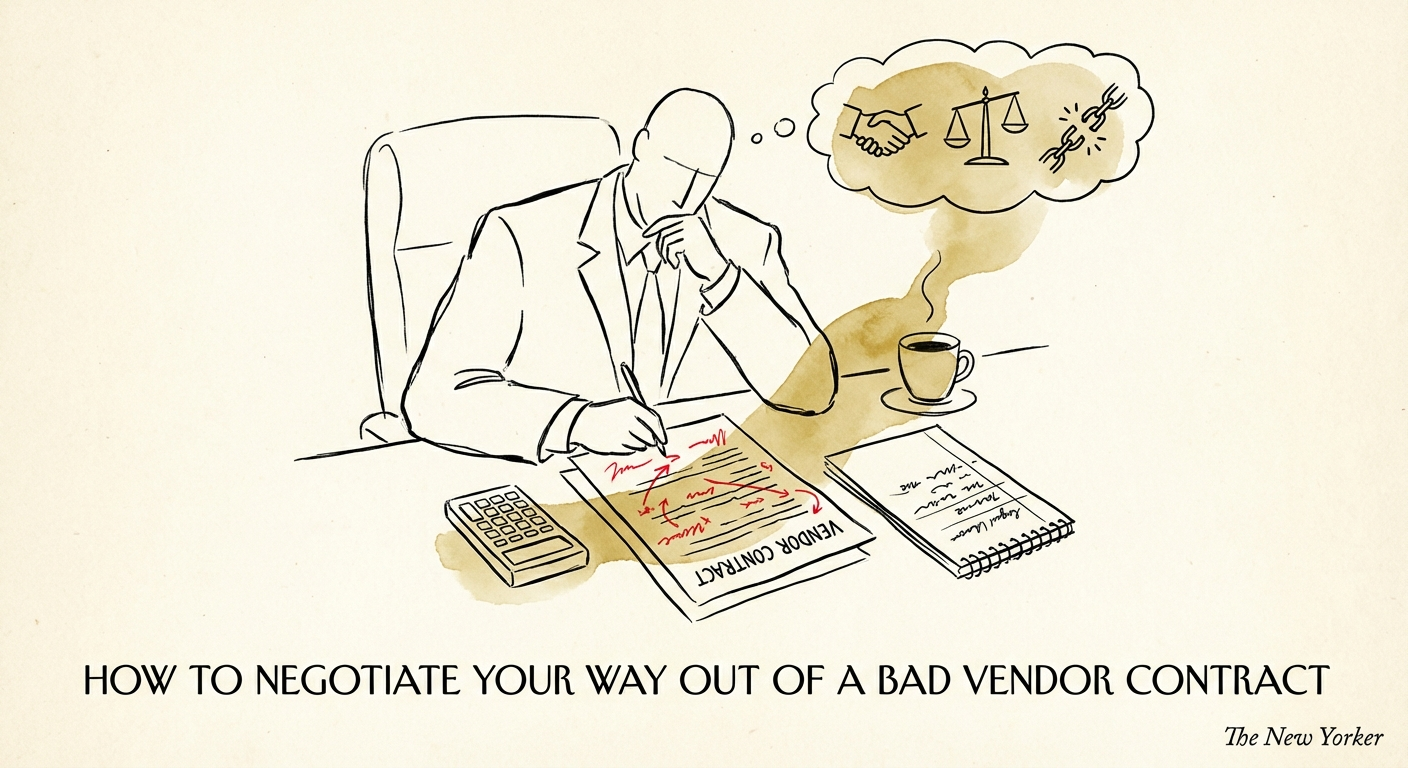
Vendor Contract Exit Playbook: How to Resolve a Bad Enterprise Agreement
Stuck in a bad vendor contract? Don't pay the termination fee. Use this 4-step leverage audit to negotiate an exit, save 30% of wasted spend, and reclaim your budget.
$21M Avg. Annual Wasted SaaS Spend
BRIEF · EXIT READINESS
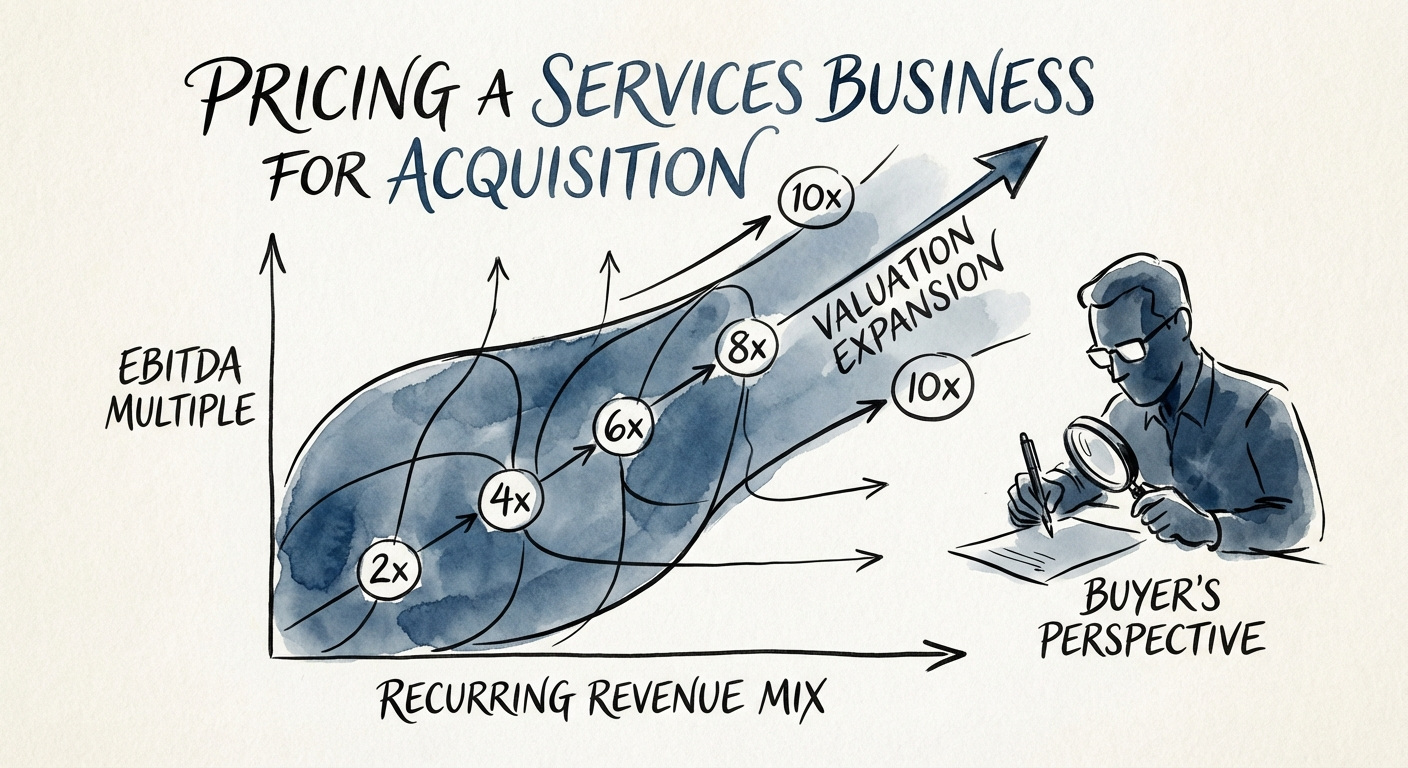
The Services Valuation Matrix: Why 4x and 12x Look the Same on the P&L
Stop using generic EBITDA multiples. 2026 data shows a 12x vs 4x valuation gap based on revenue quality. Here is the PE Operating Partners' guide to pricing services firms.
12.8x Avg. PE Entry Multiple (Top Quartile)
BRIEF · TECHNICAL DEBT
The $50K Bug vs. The Ugly Module: How SaaS Founders Should Triage Tech Debt
Your CTO wants a rewrite. Your board wants features. Here's how a B2B SaaS founder triages technical debt by what it actually costs in lost ARR.
33% Dev Time Wasted on Debt
BRIEF · PROJECT RECOVERY
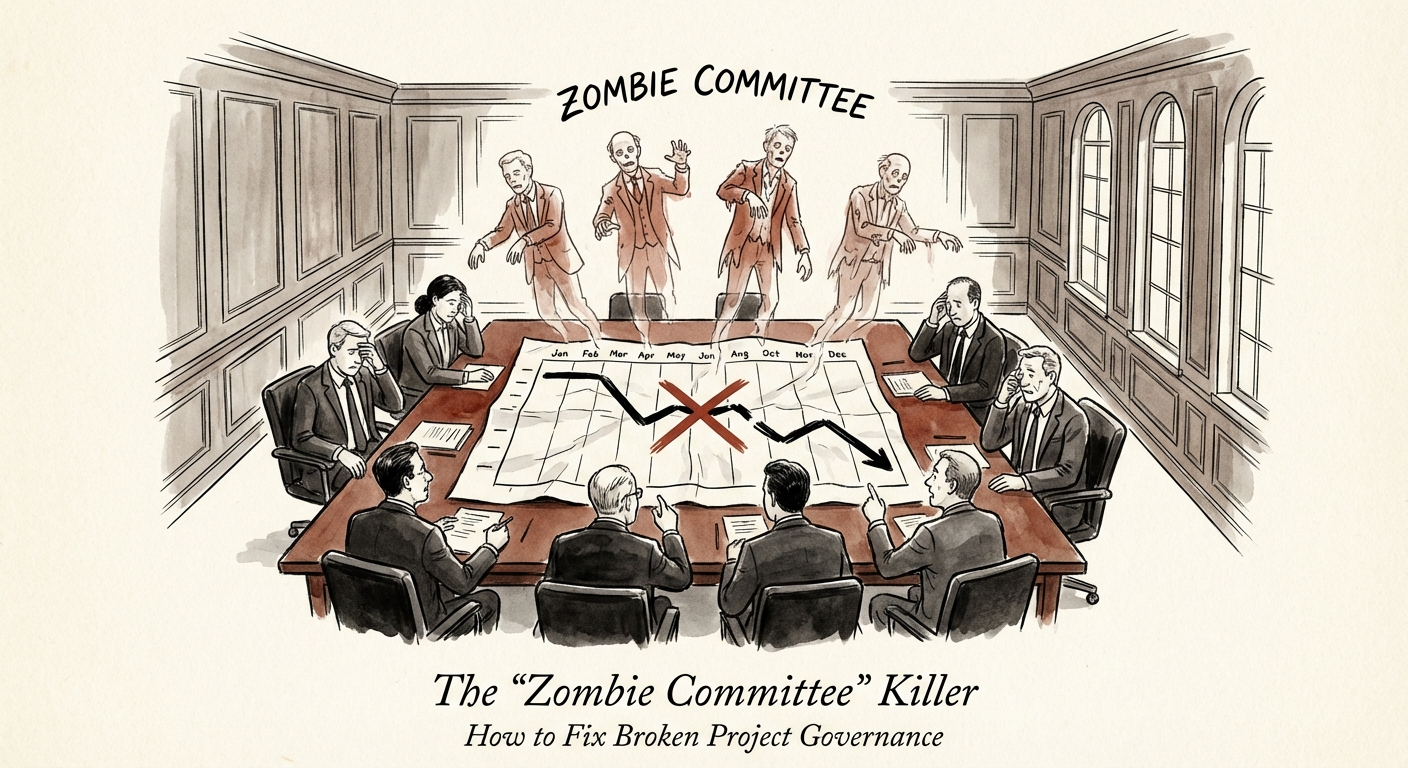
The 'Stale Committee' Killer: How to Fix Broken Project Governance
75% of enterprise IT projects fail due to governance gaps. Here is the operator's guide to running a steering committee that actually makes decisions, not just status updates.
40% Higher Success Rate
BRIEF · PROJECT RECOVERY
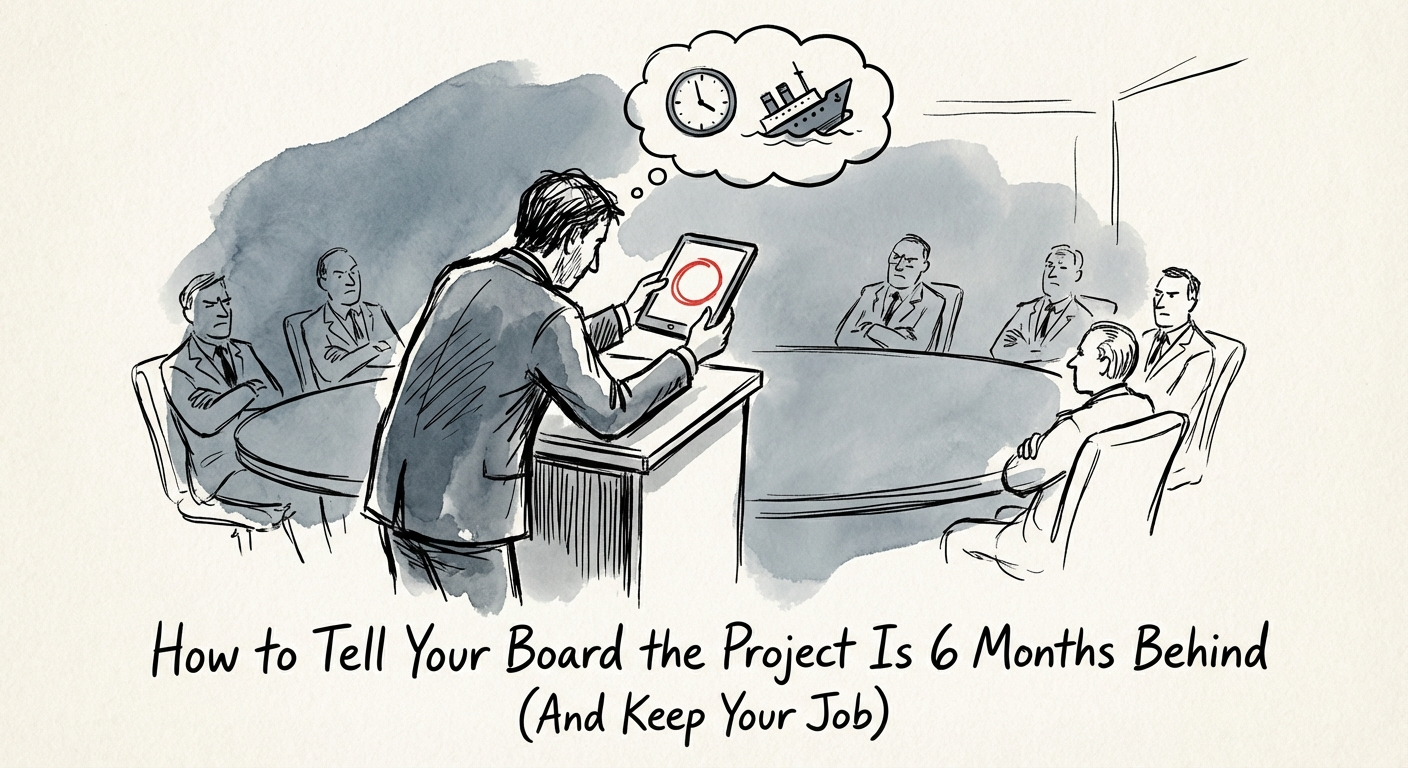
How to Tell Your Board the Project Is 6 Months Behind (And Keep Your Job)
70% of digital transformations fail. Learn the board-level communication framework to survive a 6-month delay and pivot to a 30-day rescue plan.
45% Avg. Budget Overrun
BRIEF · MIGRATION & INTEGRATION
Synergy Tracking for PE Integrations: Make Every Dollar Prove Itself
Most revenue synergies in the deal model never reach the P&L. Here's how PE operators tie every claimed dollar to a GL code, a date, and a sign-off.
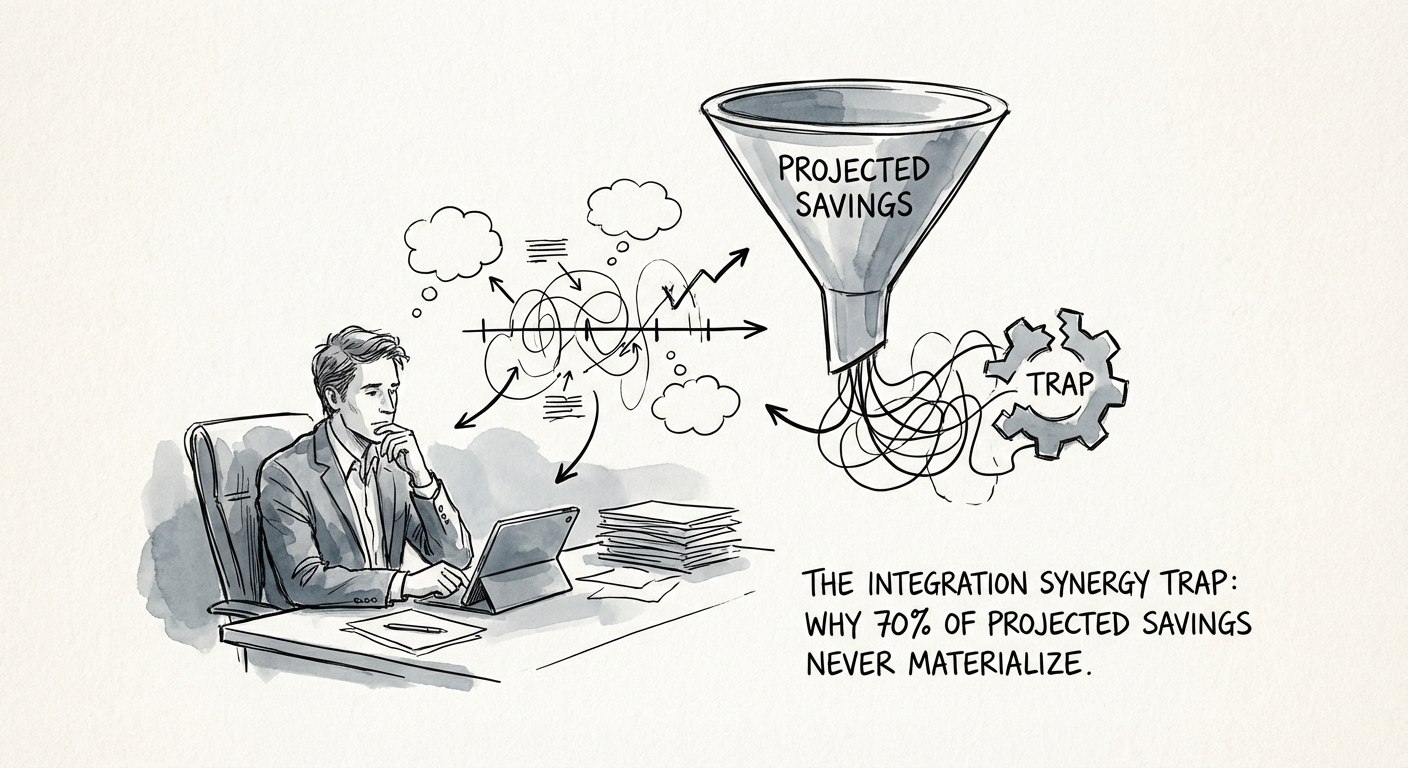
70% Synergy Failure Rate
BRIEF · MIGRATION & INTEGRATION
The Synergy Trap: Why $4M of Modeled M&A Savings Costs $5M to Capture
Your IC memo modeled $4M in synergies. Capturing them costs $1.20 per dollar, and 70% of revenue synergies never show. Here's how operating partners re-underwrite.
1.2x Cost-to-Achieve Ratio
BRIEF · TEAM & HIRING
Interim CEO vs. Turnaround CEO: Why a 'Safe Pair of Hands' Can Kill Your Exit
New 2025 data shows 33% of PE CEO replacements are now interim. Learn the critical difference between a 'caretaker' and a 'turnaround' operator before you hire.
33% Interim Placements (H1 2025)
BRIEF · TEAM & HIRING
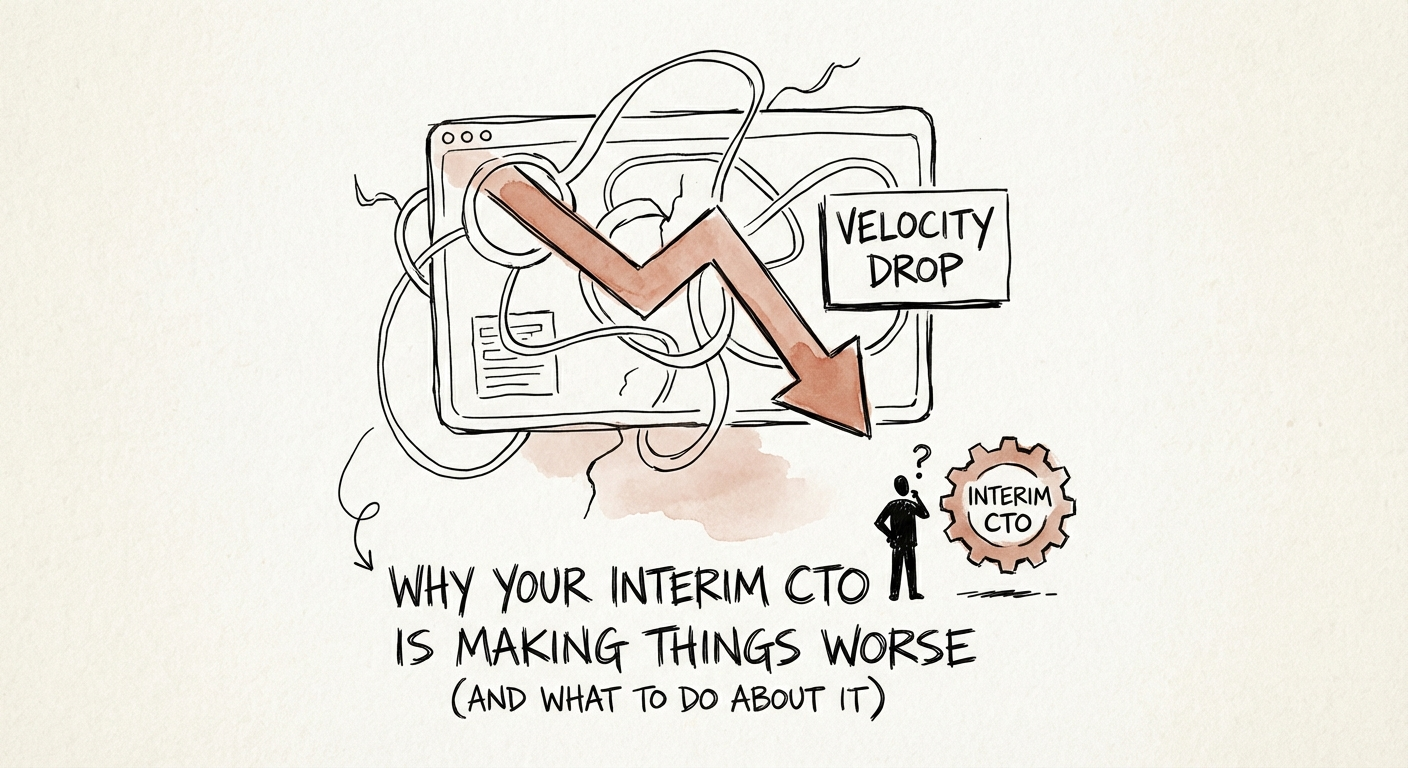
Why Your Interim CTO Is Making Things Worse (And What to Do About It)
40% of interim executives fail to deliver value. Learn why 'caretaker' CTOs stall growth and how to structure a 90-day mandate that drives EBITDA.
40% Interim Failure Rate
BRIEF · TEAM & HIRING
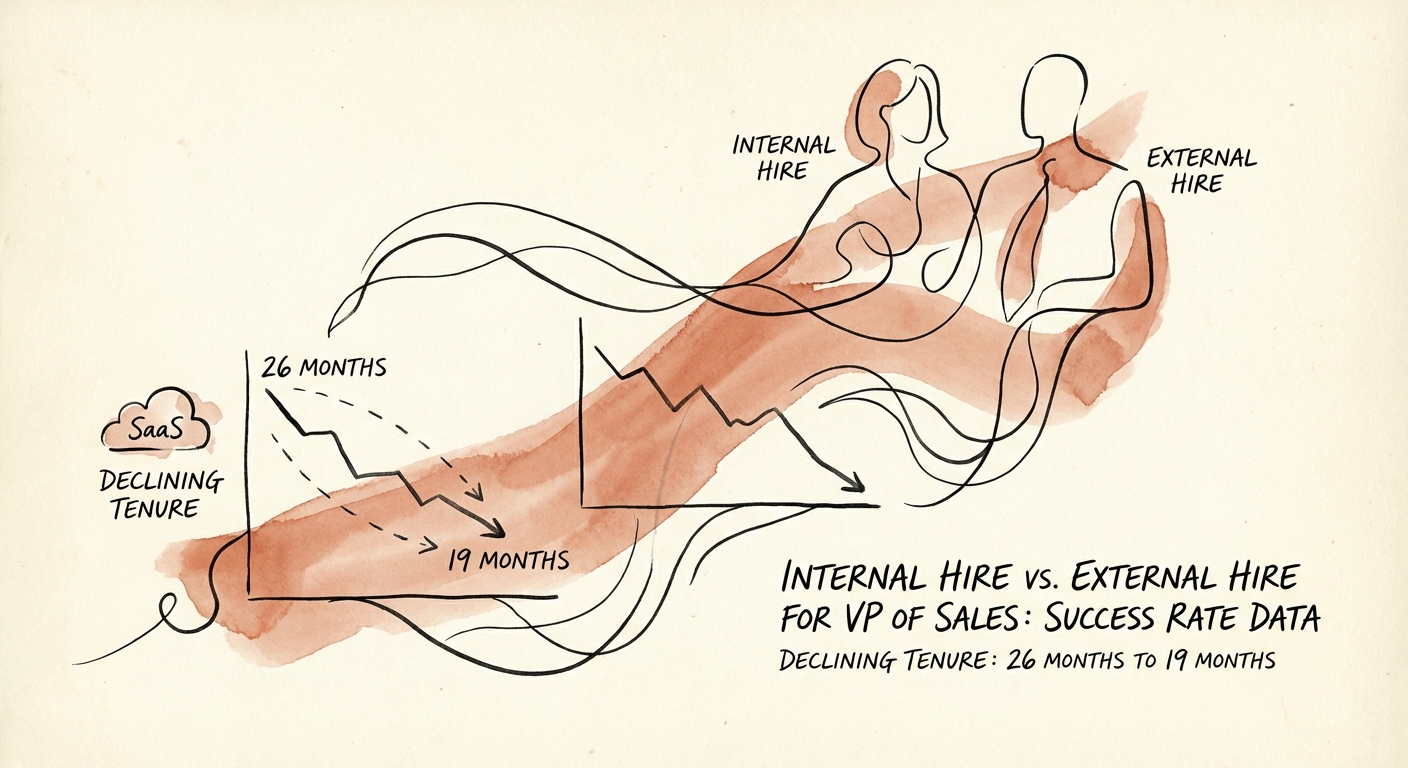
Internal Hire vs. External Hire for VP of Sales: Success Rate Data
New data shows the average VP of Sales tenure is just 19 months. We analyze success rates for internal promotions vs. external hires for Series B startups.
19 Months Avg VP Sales Tenure
BRIEF · FINANCIAL INFRASTRUCTURE
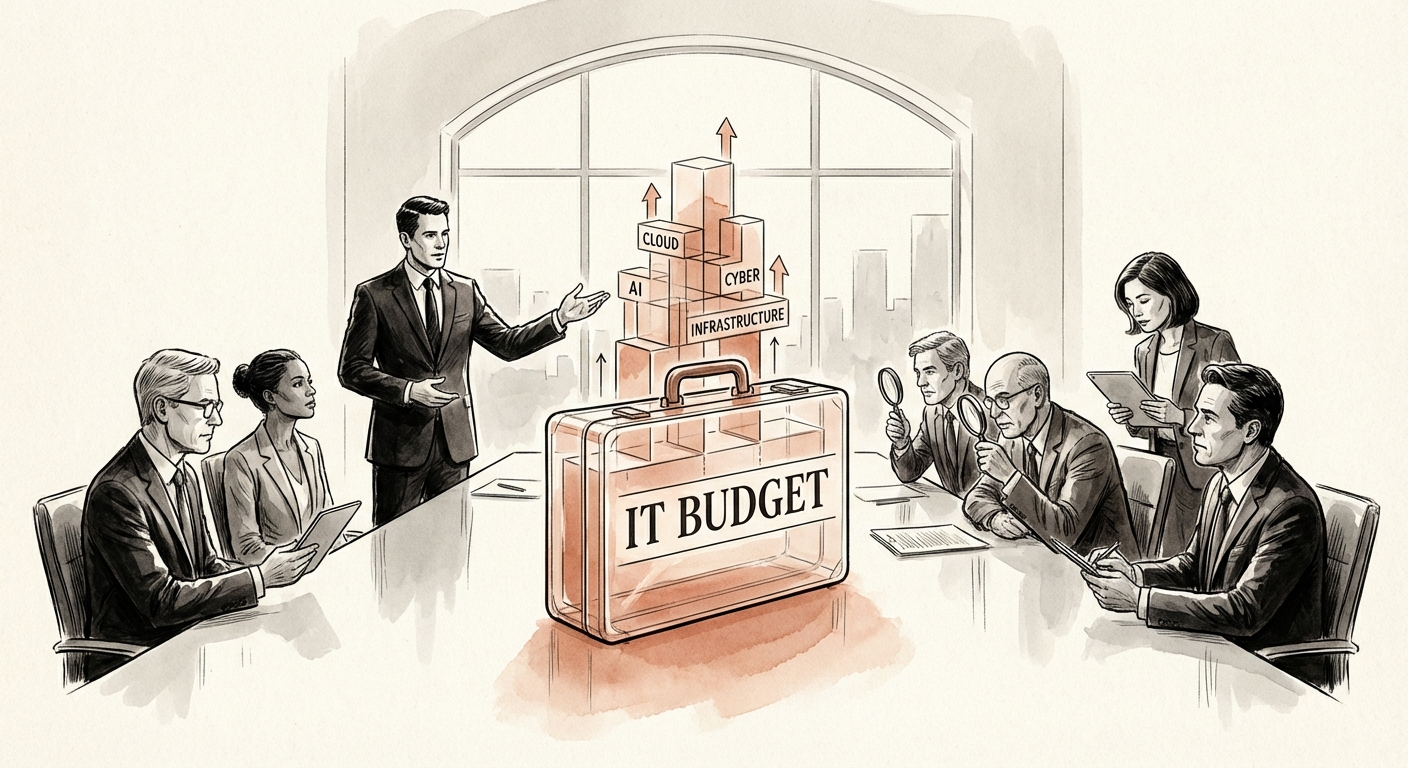
How to Build an IT Budget That Survives Board Scrutiny
70% of IT projects fail to deliver value. Learn the framework that turns your IT budget from a 'black box' cost center into a defensible investment portfolio.
70% Project Failure Rate
BRIEF · TECHNICAL DEBT
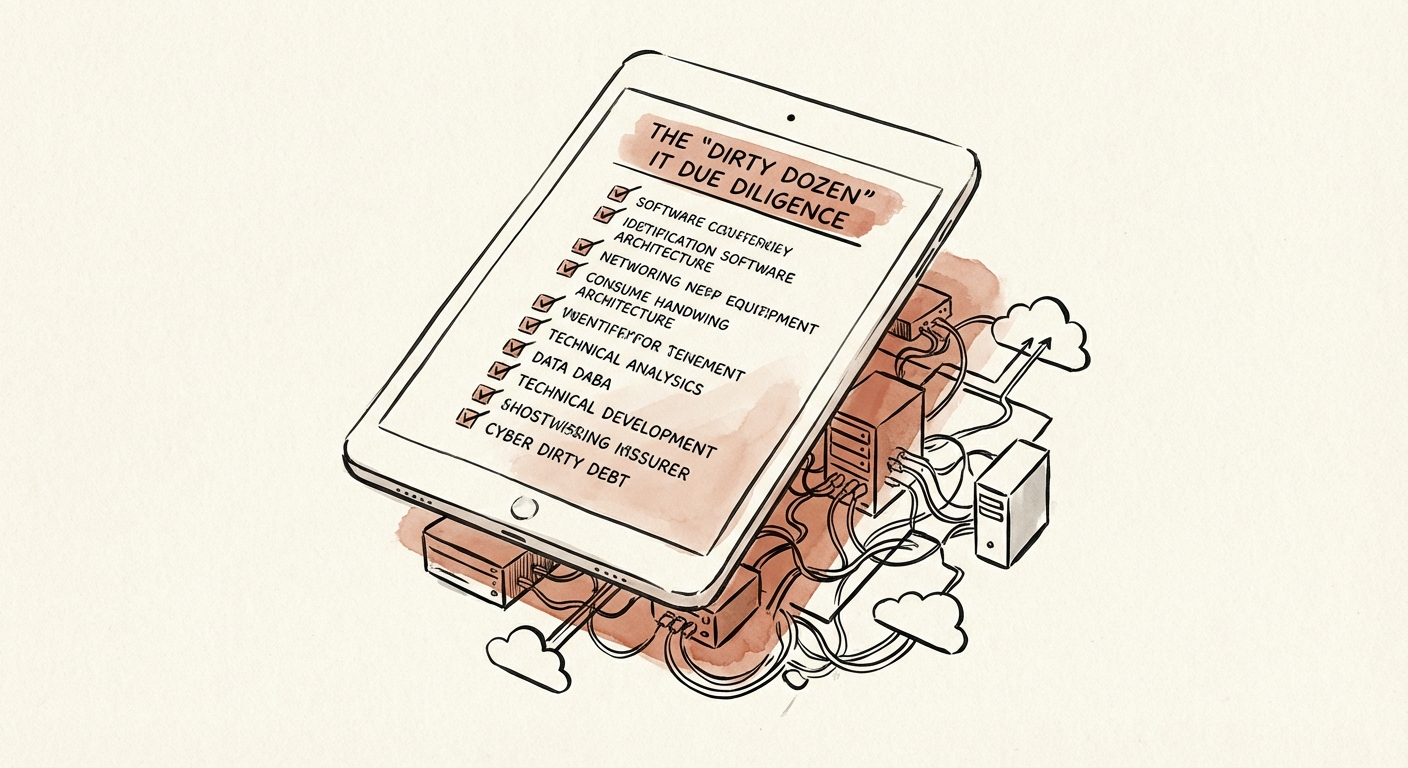
The 'Dirty Dozen': 12 IT Due Diligence Documents That Reveal the Truth Behind the Deal
Stop buying broken code. The essential IT due diligence checklist for PE sponsors to uncover hidden technical debt and protect deal value.
40% Value of Tech Estate as Debt
BRIEF · MIGRATION & INTEGRATION
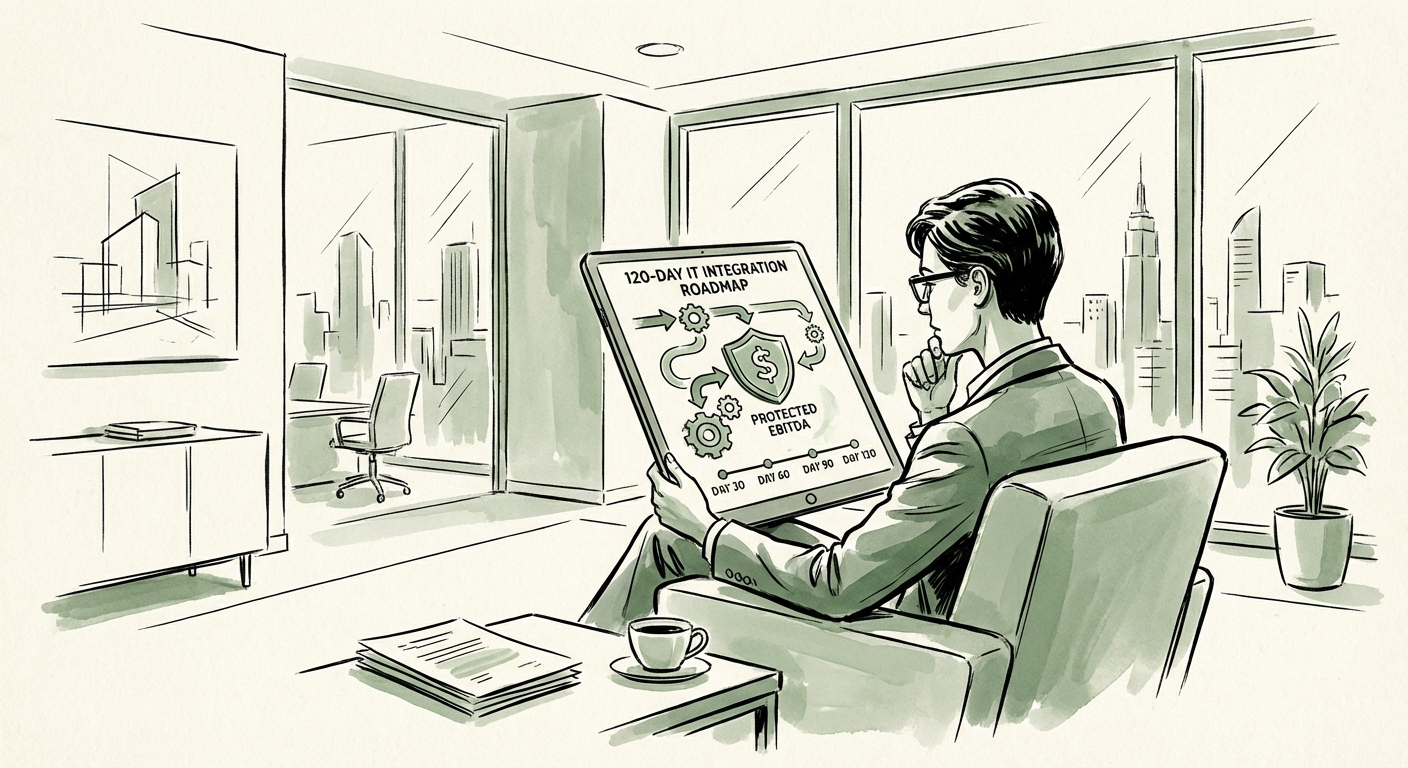
Why Your IT Integration Should Take 120 Days, Not 100
The 100-day plan finishes IT integration too fast and waits too long. Here's a 120-day sequence that front-loads risk and back-loads architecture decisions.
50% Of M&A Value Lost to Slow Integration