BRIEF · TEAM & HIRING
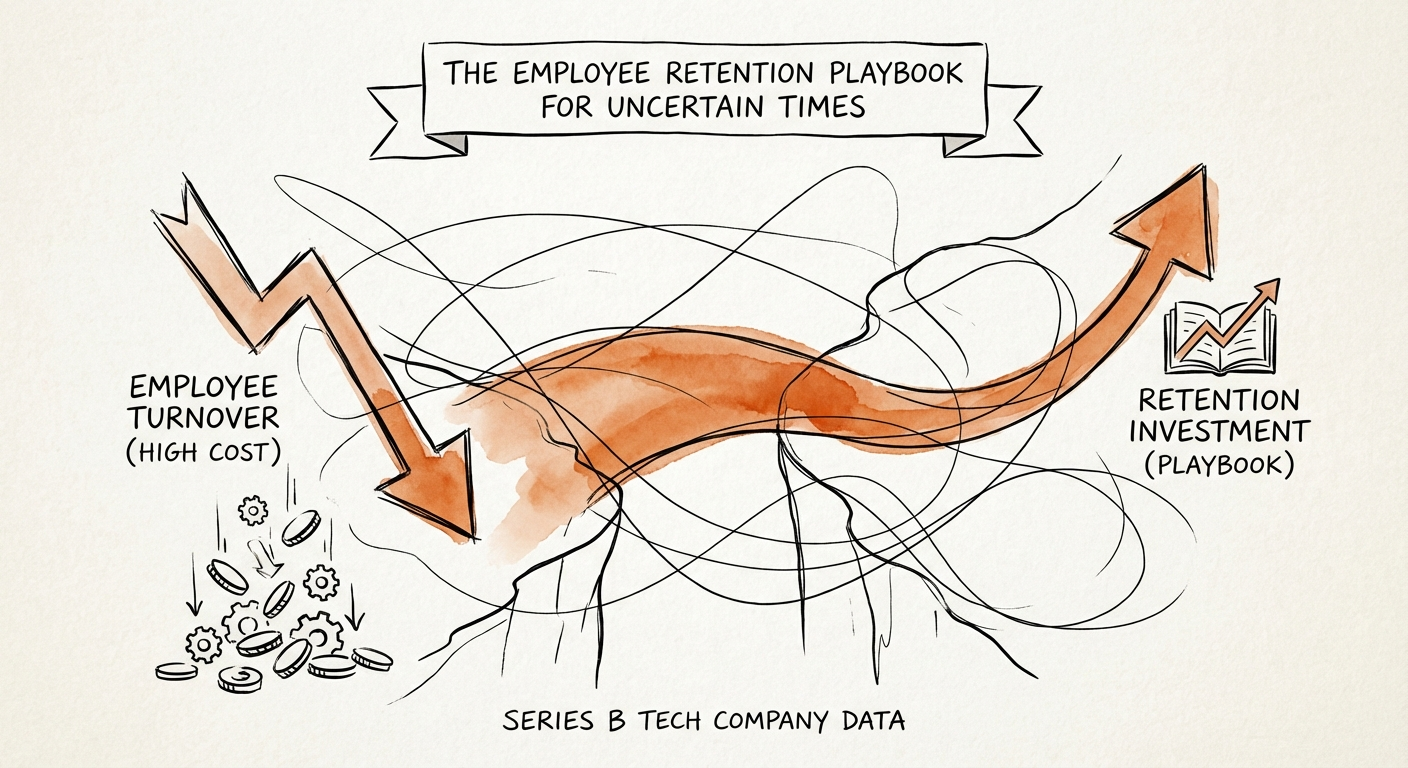
The Employee Retention Playbook for Uncertain Times: Stop the Bleeding Before It Starts
New 2026 data shows tech turnover costing 213% of salary. Learn the retention playbook for Series B founders to stop the 'Great Detachment.'
213% Replacement Cost (Specialized Tech Roles)
BRIEF · TEAM & HIRING
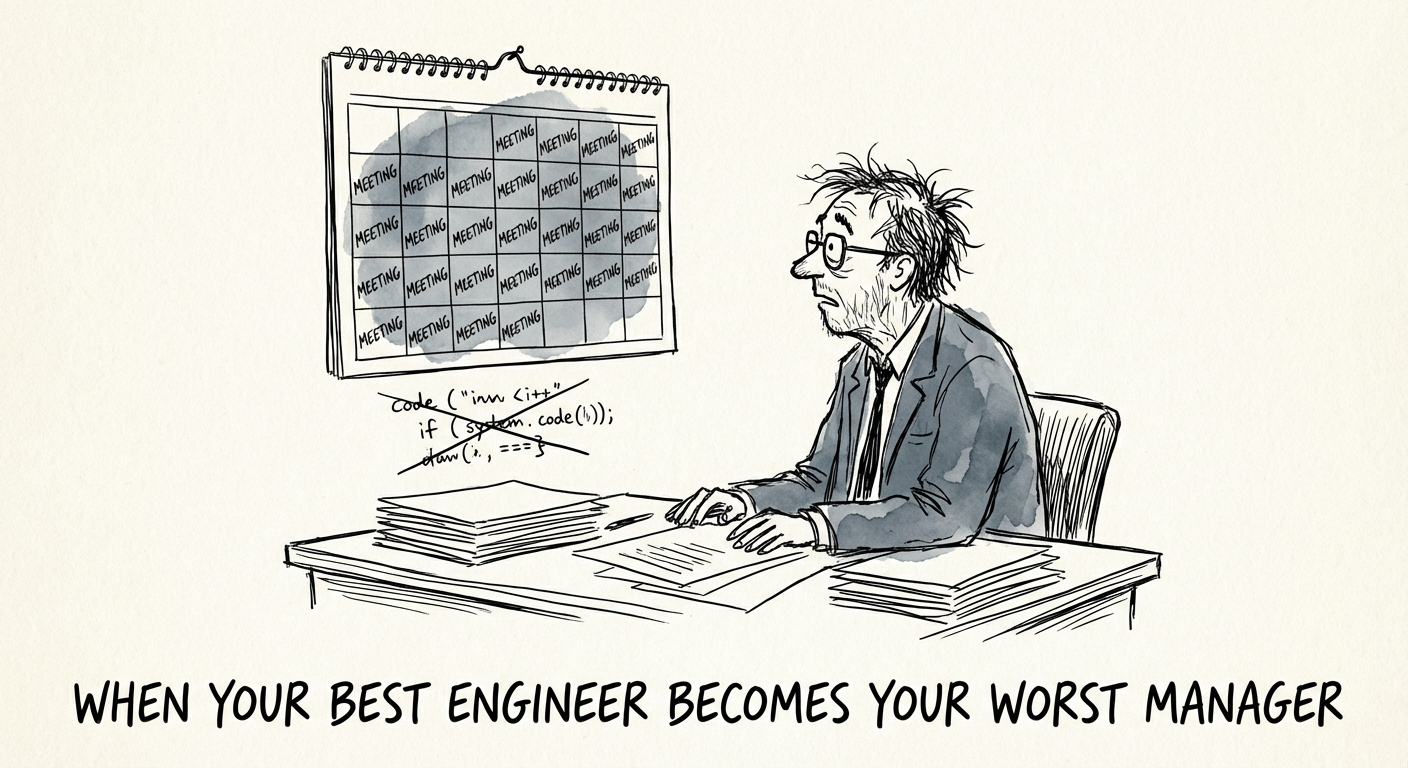
Your Best Engineer Is Now Your Worst Manager. Here's the Reversal Play.
You promoted your 10x engineer and velocity tanked. The first-18-month failure rate runs ~40%. Here's the demotion-free reversal that keeps the engineer and the team.
40% Failure Rate (New Managers)
BRIEF · COMPLIANCE & SECURITY
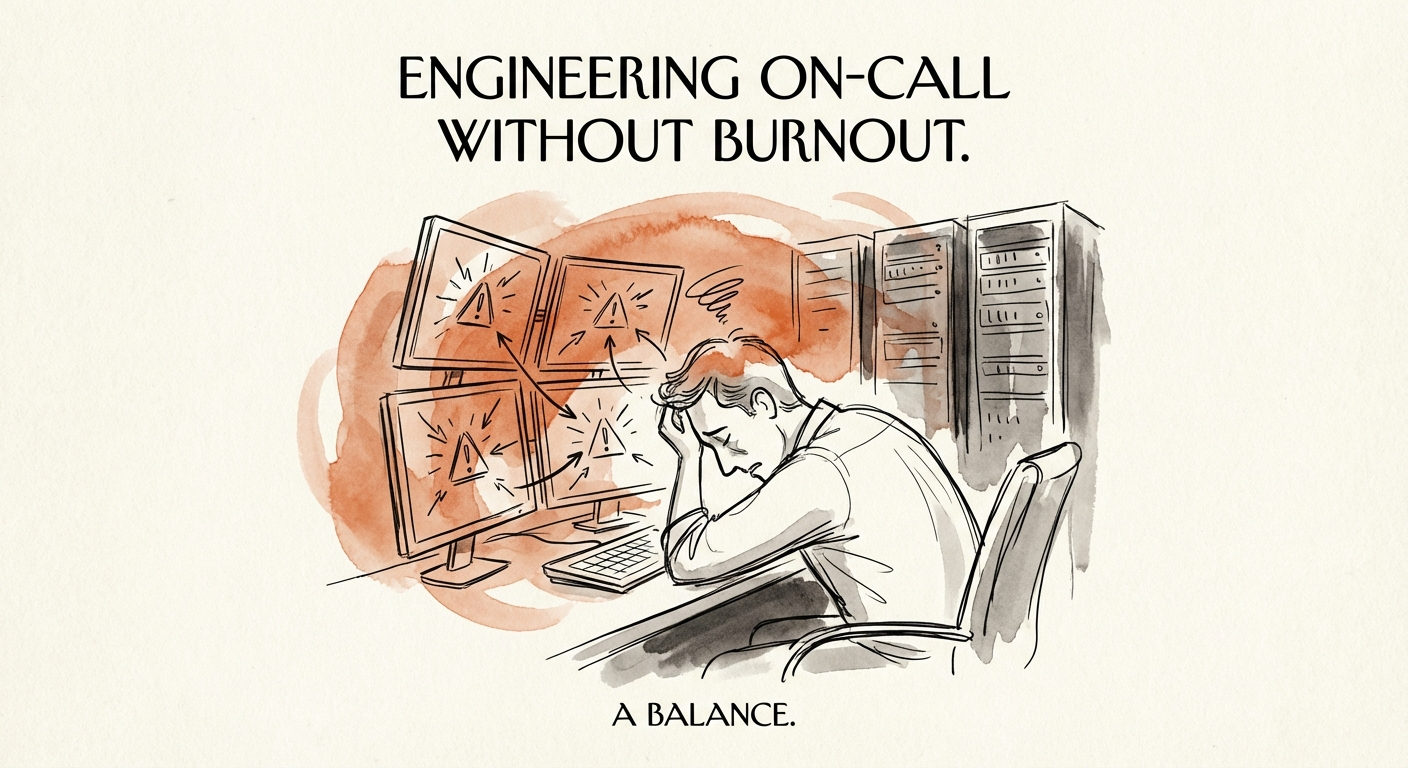
The 3 AM Pager Is a SOC 2 Risk: Fixing On-Call Before It Costs You Your Best Engineer
In B2B SaaS, your on-call rotation is a SOC 2 control and a retention bet. A diagnostic for CEOs to fix incident response before the hero engineer quits.
23% Engineering Turnover Rate
BRIEF · MIGRATION & INTEGRATION
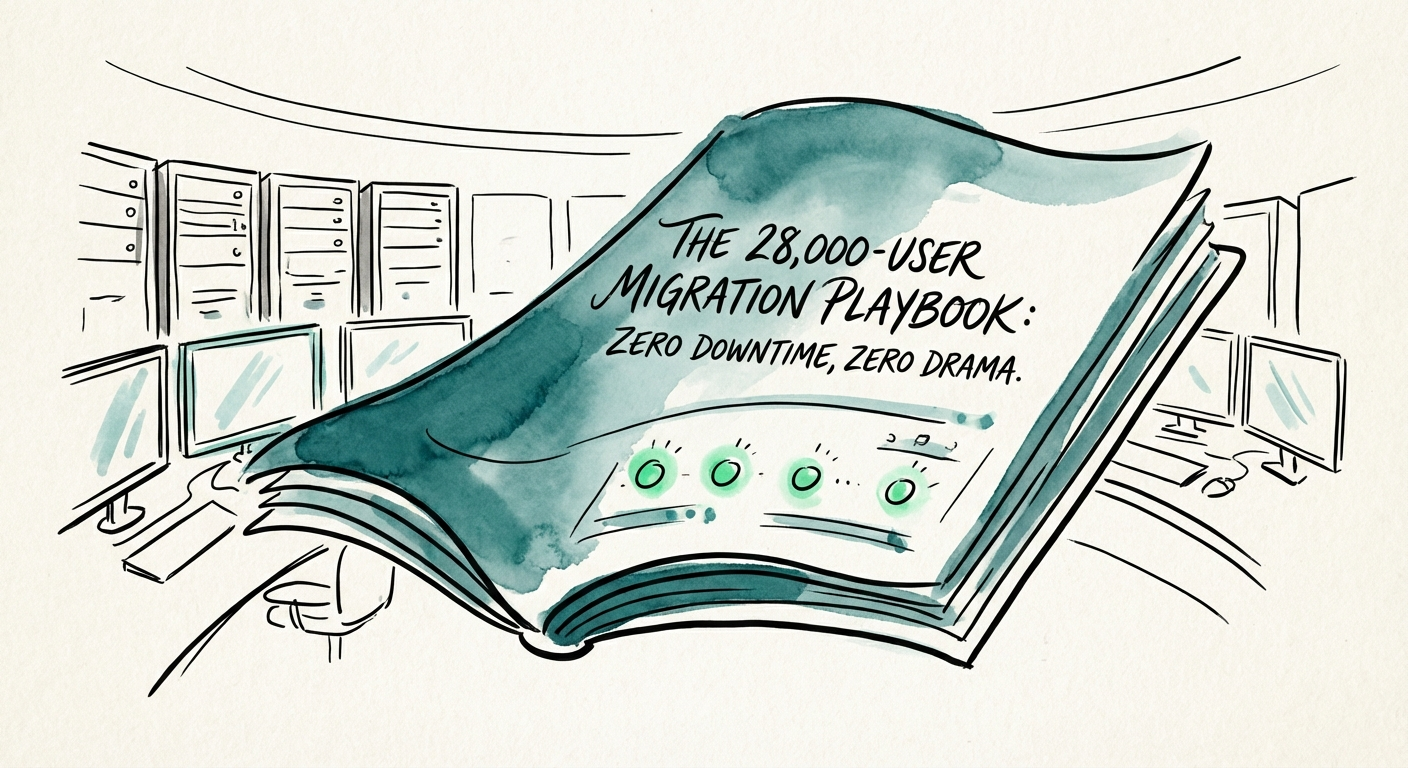
Migrating 28,000 Users With Zero Downtime: The CIO's Cutover Playbook
A 28,000-seat enterprise cutover that started Monday with no crash and no ticket flood. The IAM, shadow-run, and war-room moves that got it there.
28,000 Users Migrated (Zero Downtime)
BRIEF · EXIT READINESS
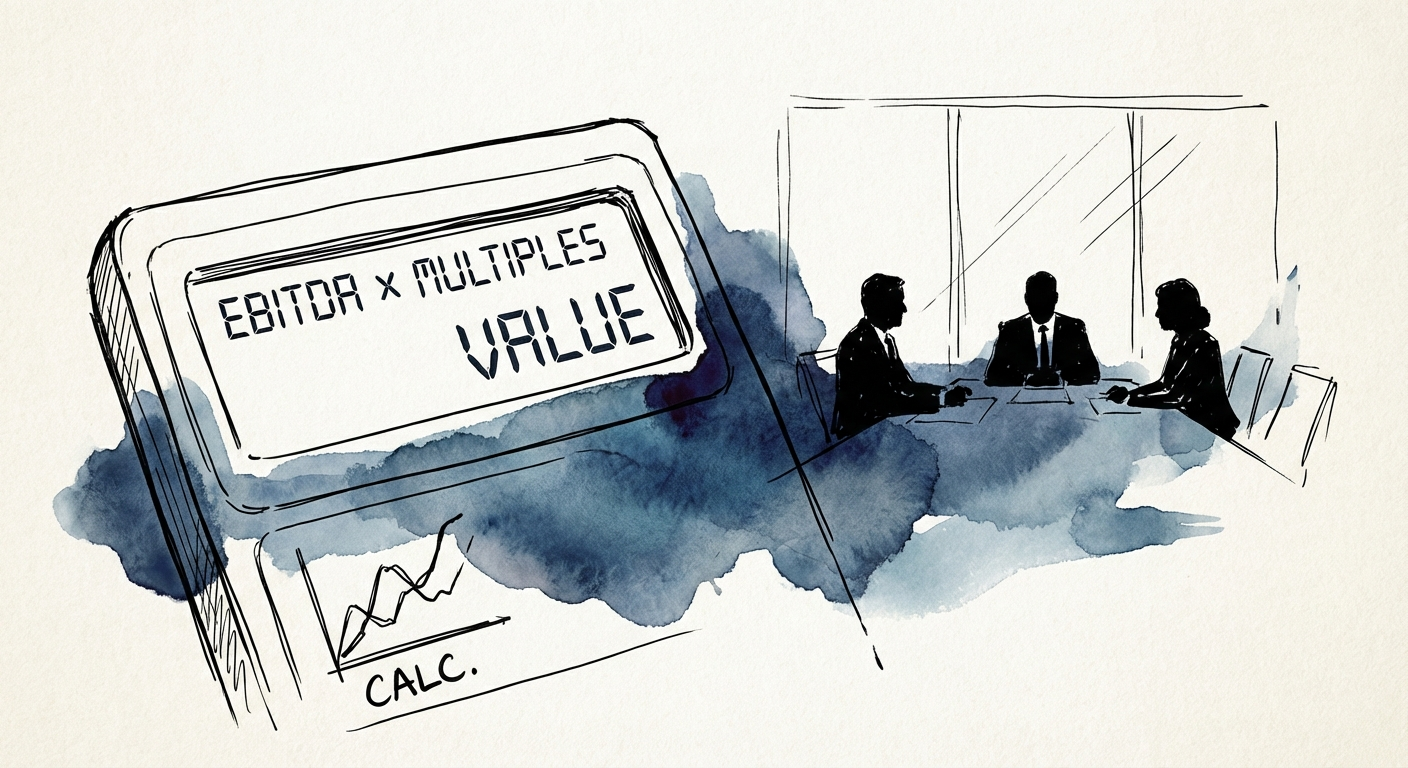
The Founder’s Enterprise Value Calculator: Why Your Services Firm Is Worth Less Than You Think (And How to Fix It)
Founders often mistake revenue multiples for valuation. Discover the 2026 Enterprise Value formula for services firms and how to move from 8x to 12x EBITDA.
9.8% Avg. Services EBITDA Margin (2025)
BRIEF · MIGRATION & INTEGRATION
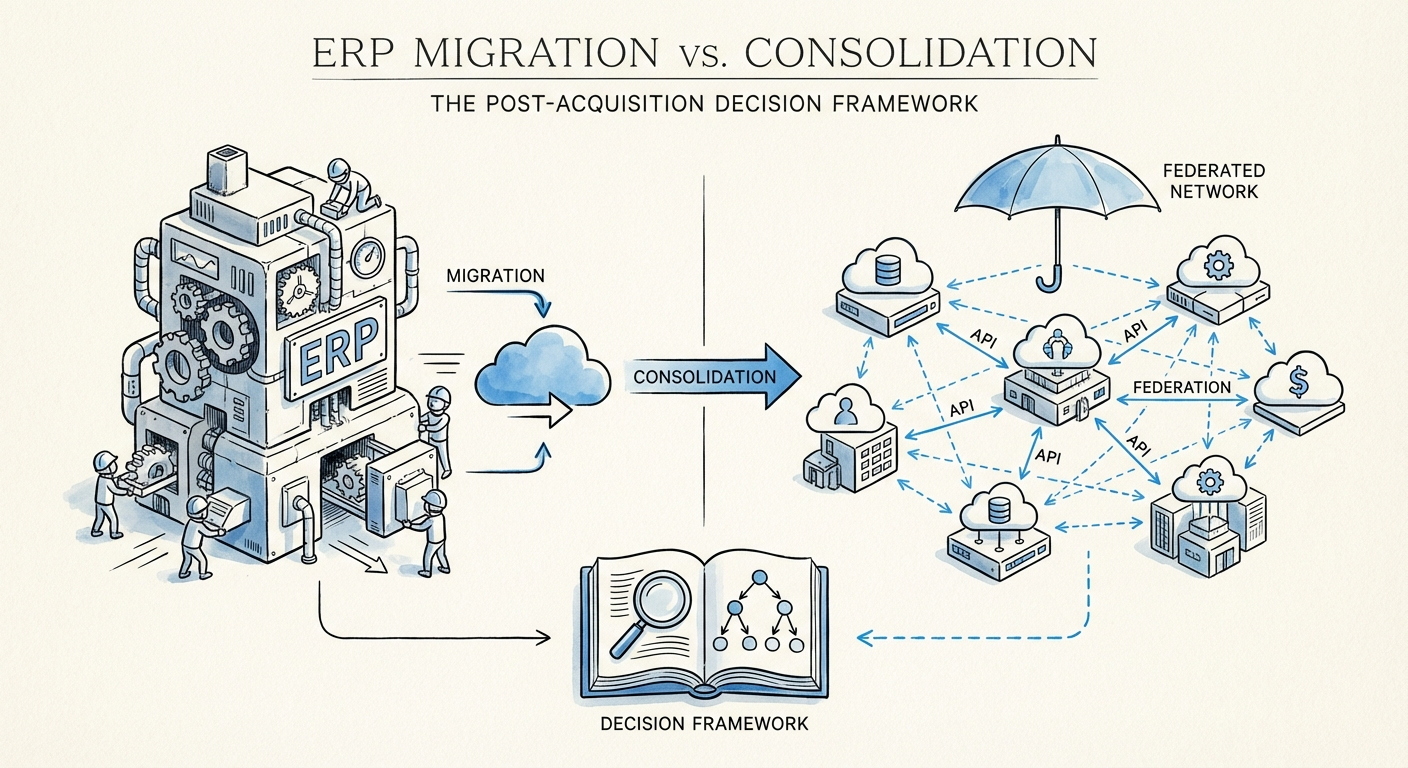
ERP After an Add-On: When to Consolidate, When to Federate
The IT-synergy line in your value creation plan assumes one ERP. Here's the 30-day fork — consolidate, federate, or modernize — that protects year-one EBITDA.
75% ERP Project Failure Rate
BRIEF · FINANCIAL INFRASTRUCTURE
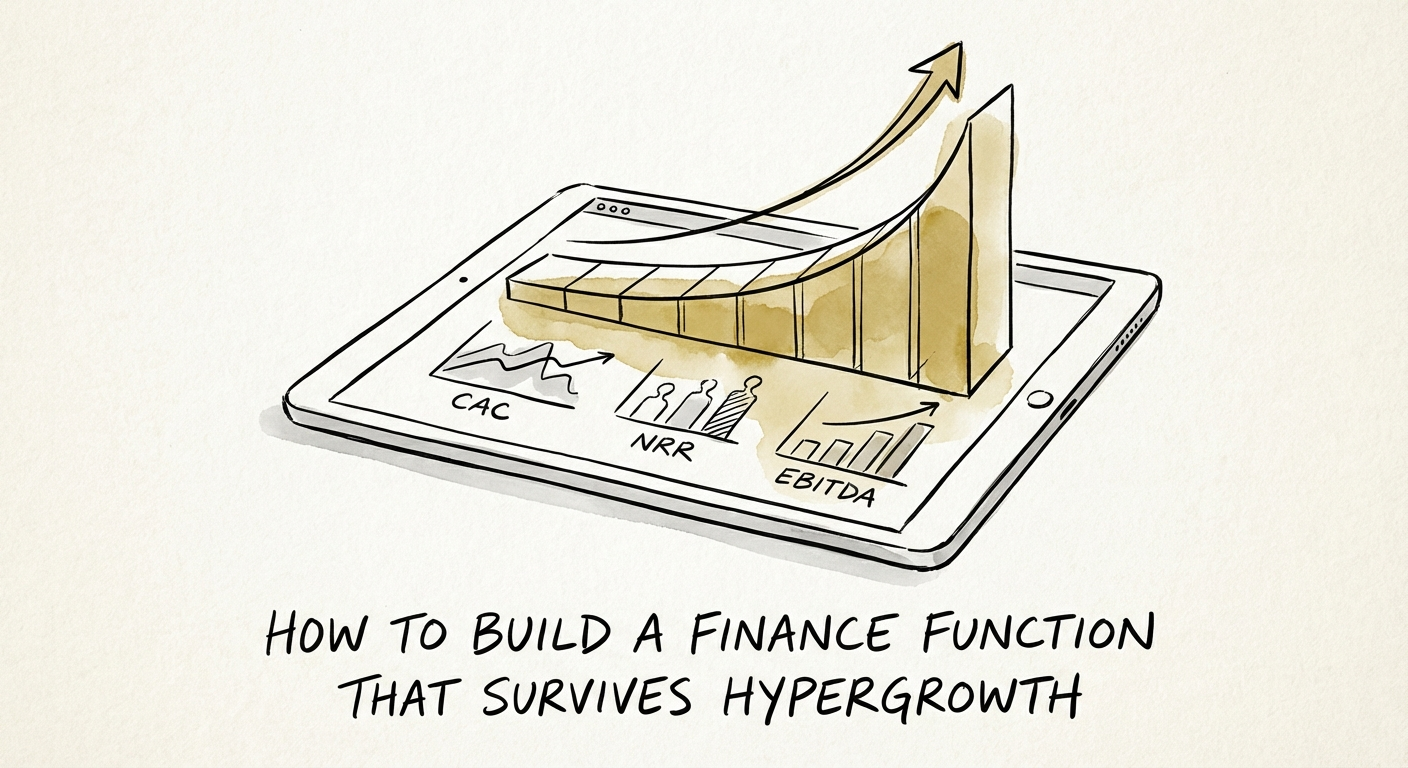
The Series B Finance Cliff: Rebuilding the Function Before the Spreadsheet Quits
At $10M ARR your finance stack snaps. Here's the 90-day rebuild that drops month-end close from 15 days to under 5 and makes your forecast trustworthy.
4.9x Finance Team Growth Rate vs. Other Depts
BRIEF · FINANCIAL INFRASTRUCTURE
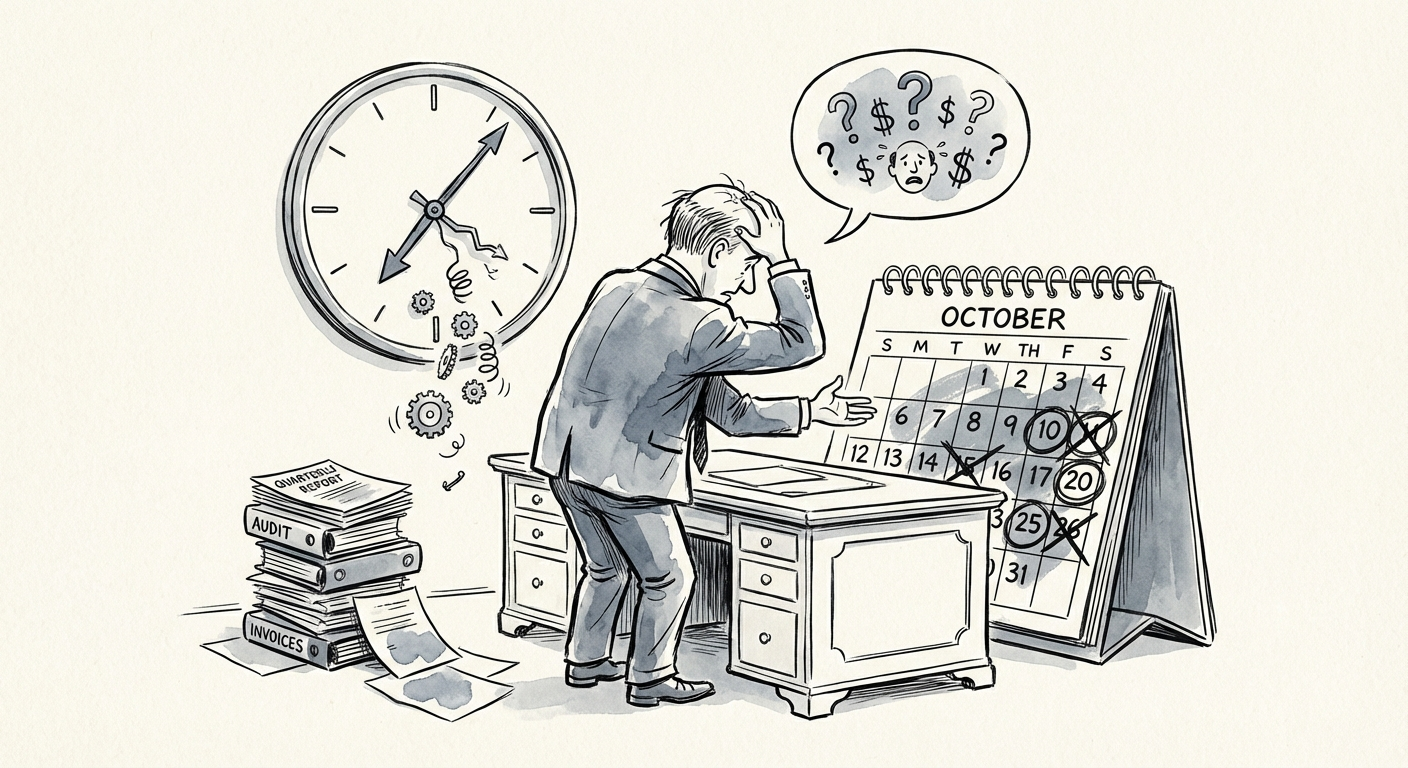
Why Your Financial Close Takes Too Long (And What It Costs You)
If your month-end close takes 15 days, you are operating in a 50% blind zone. Benchmarks show top performers close in 4 days. Here is how to fix it.
15 Days Blind Zone Duration

BRIEF · FINANCIAL INFRASTRUCTURE
How to Build a Financial Model That PE Firms Will Actually Believe
Why weak financial models get repriced or stall in diligence. How to build a defensible, PE-grade financial model that survives the Quality of Earnings audit.
5% Target Forecast Variance Threshold
BRIEF · COMPLIANCE & SECURITY
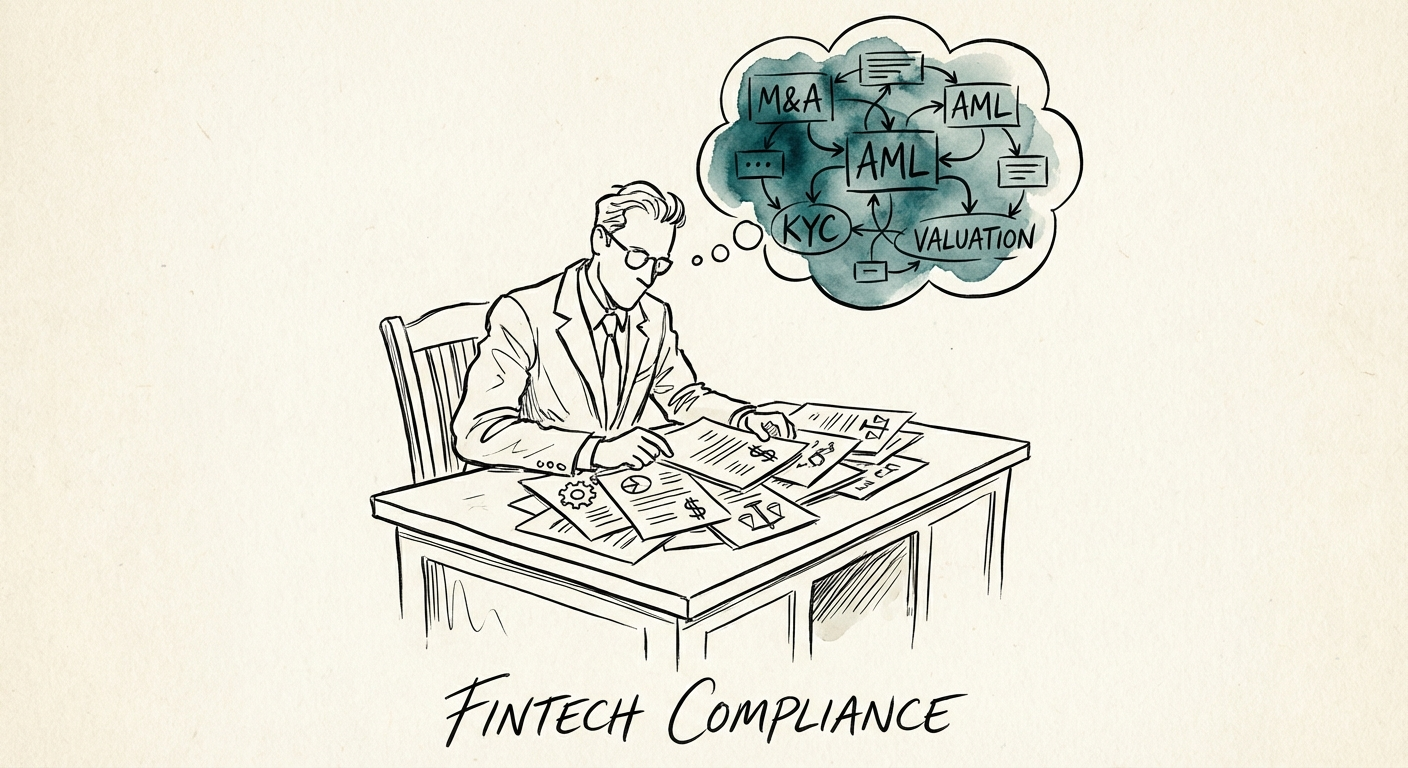
The Compliance Discount: Why Fintech Valuations Bleed 15% in Due Diligence
New 2026 data: Non-compliance costs 2.7x more than proactive governance. Learn how regulatory debt reduces fintech exit multiples and how to fix it.
2.71x Cost of Non-Compliance Multiplier
BRIEF · PROCESS DOCUMENTATION
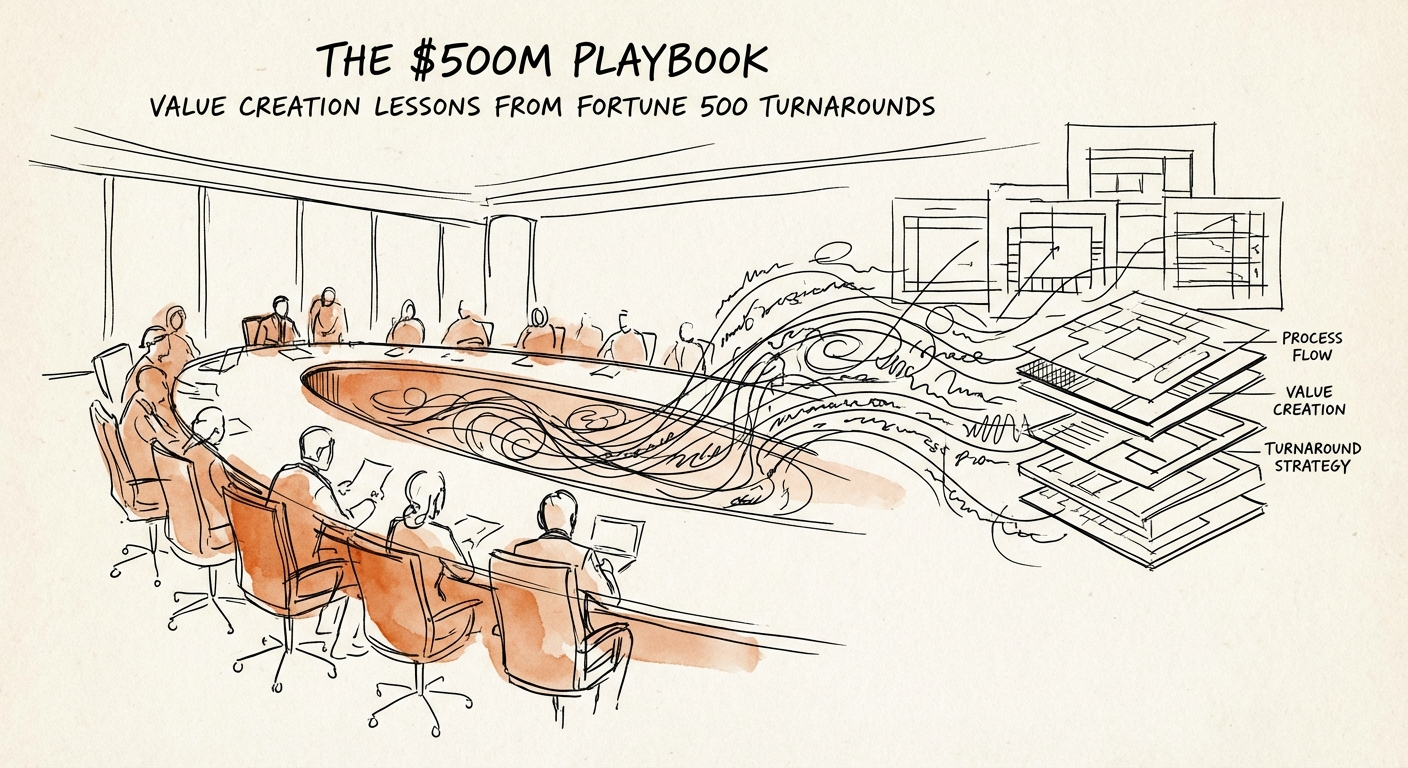
The $500M Playbook: Why Fortune 500 Turnarounds Start with Process, Not Strategy
88% of enterprise transformations fail. Learn the $500M process documentation playbook that Fortune 500 CIOs use to rescue stalled initiatives.
88% Transformation Failure Rate
BRIEF · FOUNDER EXTRACTION
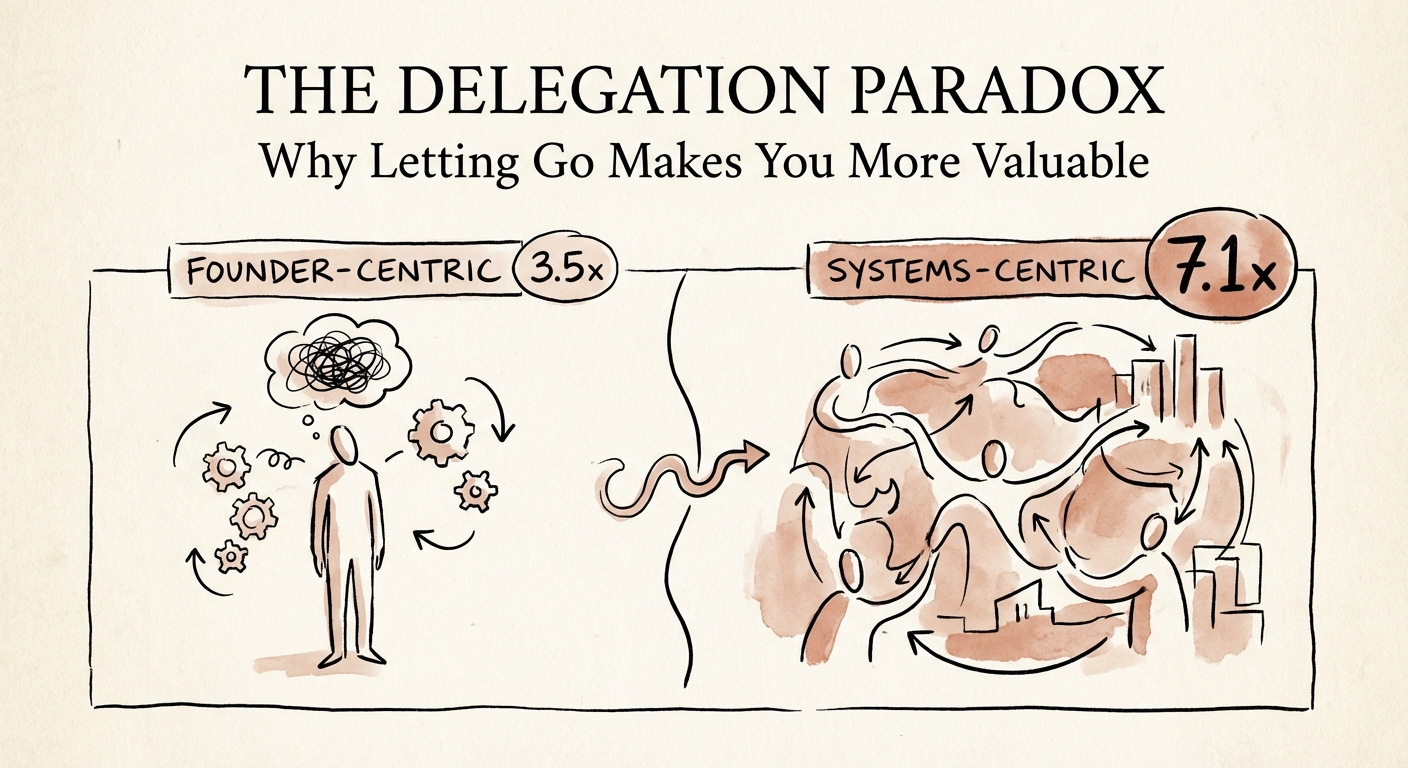
The Delegation Paradox: How "Nobody Does It Like I Do" Cuts Your Multiple From 7.1x to 3.5x
A buyer pays 7.1x for a B2B tech firm that runs without its founder and 3.5x for one that doesn't. Here's the exact math behind that 50% haircut — and how to close it.
7.1x EBITDA Multiple for Autonomous Firms
BRIEF · FOUNDER EXTRACTION
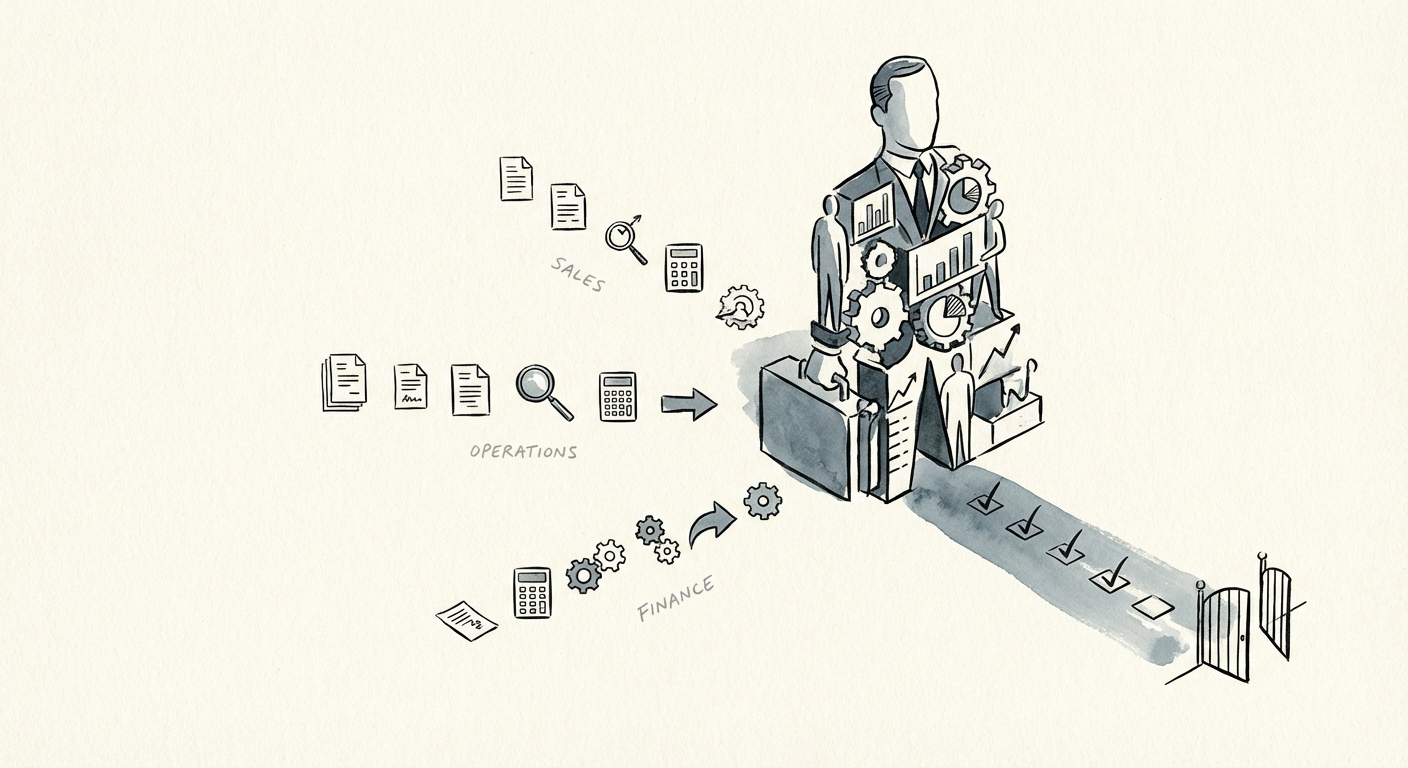
The Founder Extraction Checklist: 30 Processes Buyers Test Before They Pay Your Earnout
Most earnouts pay less than half their max — usually because the founder is the operating system. The 30 processes diligence buyers actually test, and how to document them fast.
60% Earnouts Missed
BRIEF · EXIT READINESS
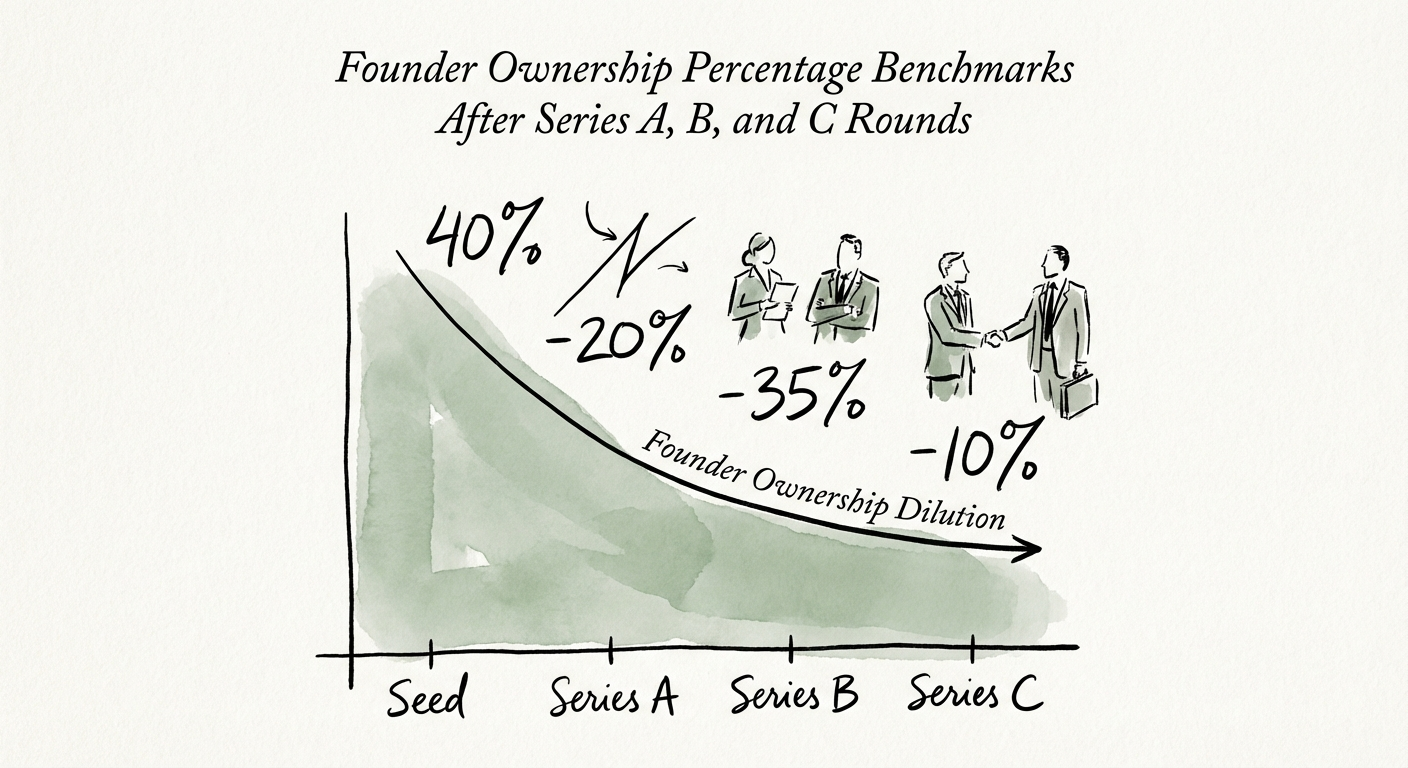
The Dilution Reality: Founder Ownership Benchmarks for Series A, B, and C (2025 Edition)
New 2025 data from Carta & SaaStr reveals median founder ownership drops to 36% at Series A and 23% at Series B. See where you stand.
23% Median Founder Ownership Post-Series B
BRIEF · FOUNDER EXTRACTION
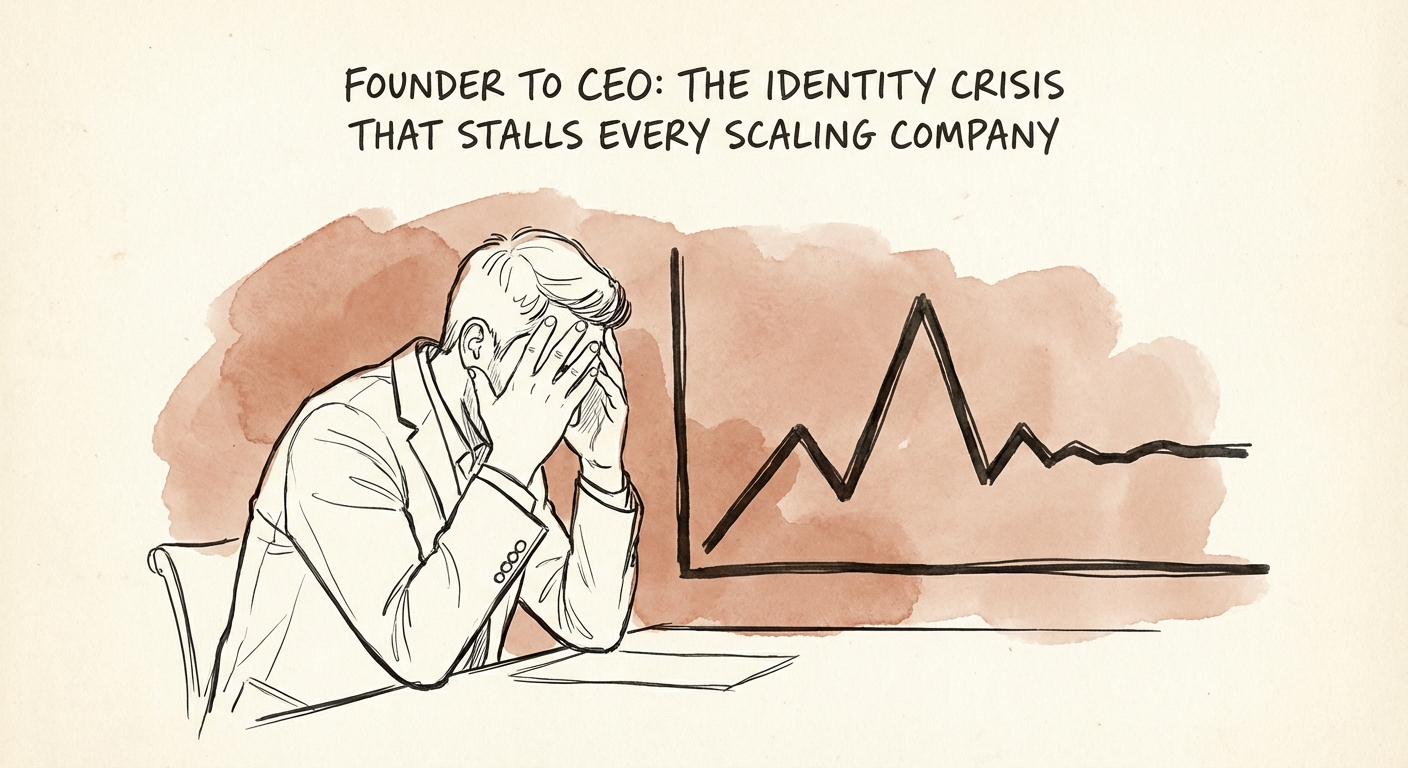
Founder to CEO: Why VC-Backed Startups Stall at the Series B Threshold
Most VC-backed founders are replaced by Series C. Here is the exact failure pattern between Series A and B, and the four moves that get you through it as CEO.
52% Founders Replaced by Series C
BRIEF · FOUNDER EXTRACTION
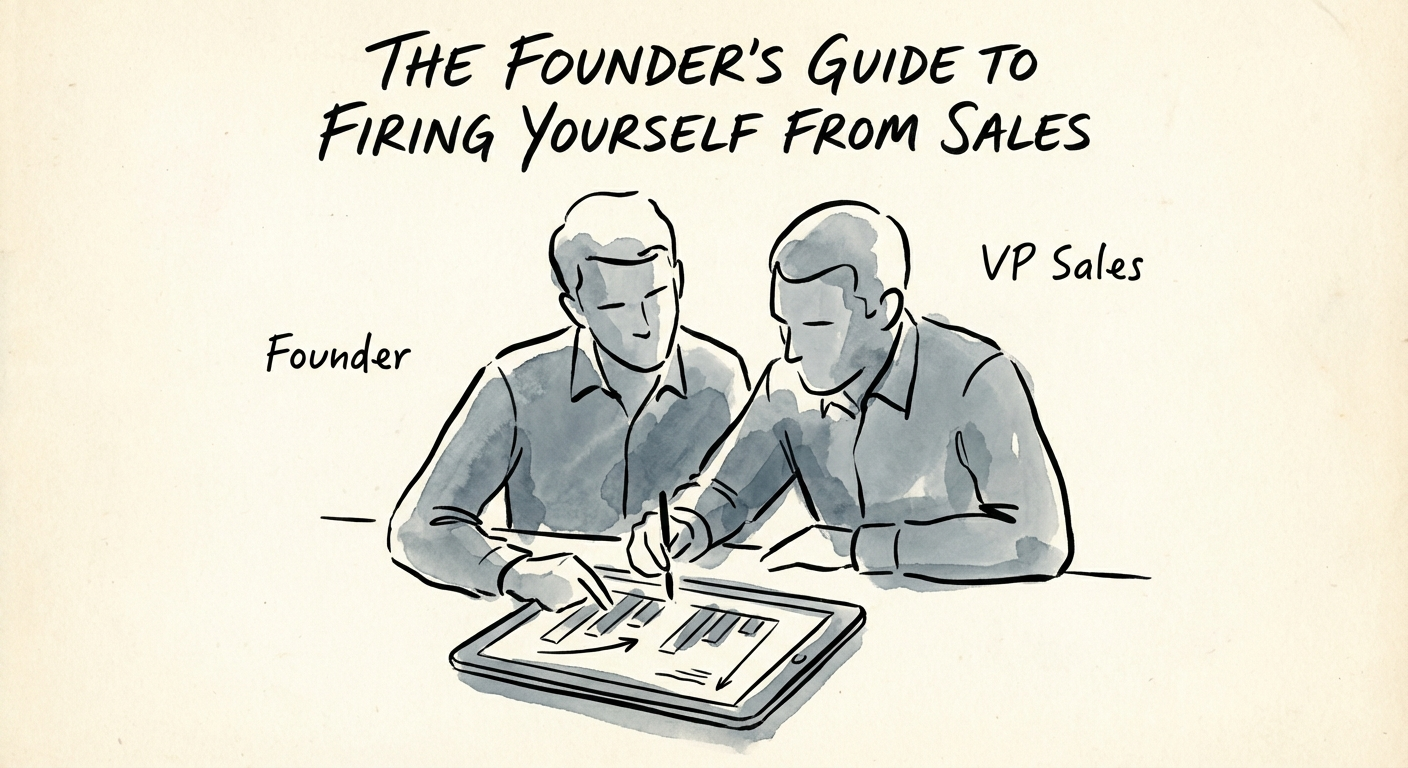
The Founder's Guide to Firing Yourself from Sales (Before You Kill Your Growth)
70% of founder-led firms stall at $10M revenue. Here is the diagnostic guide to firing yourself from sales without tanking your win rate.
70% Stall Rate at $10M Rev
BRIEF · FOUNDER EXTRACTION
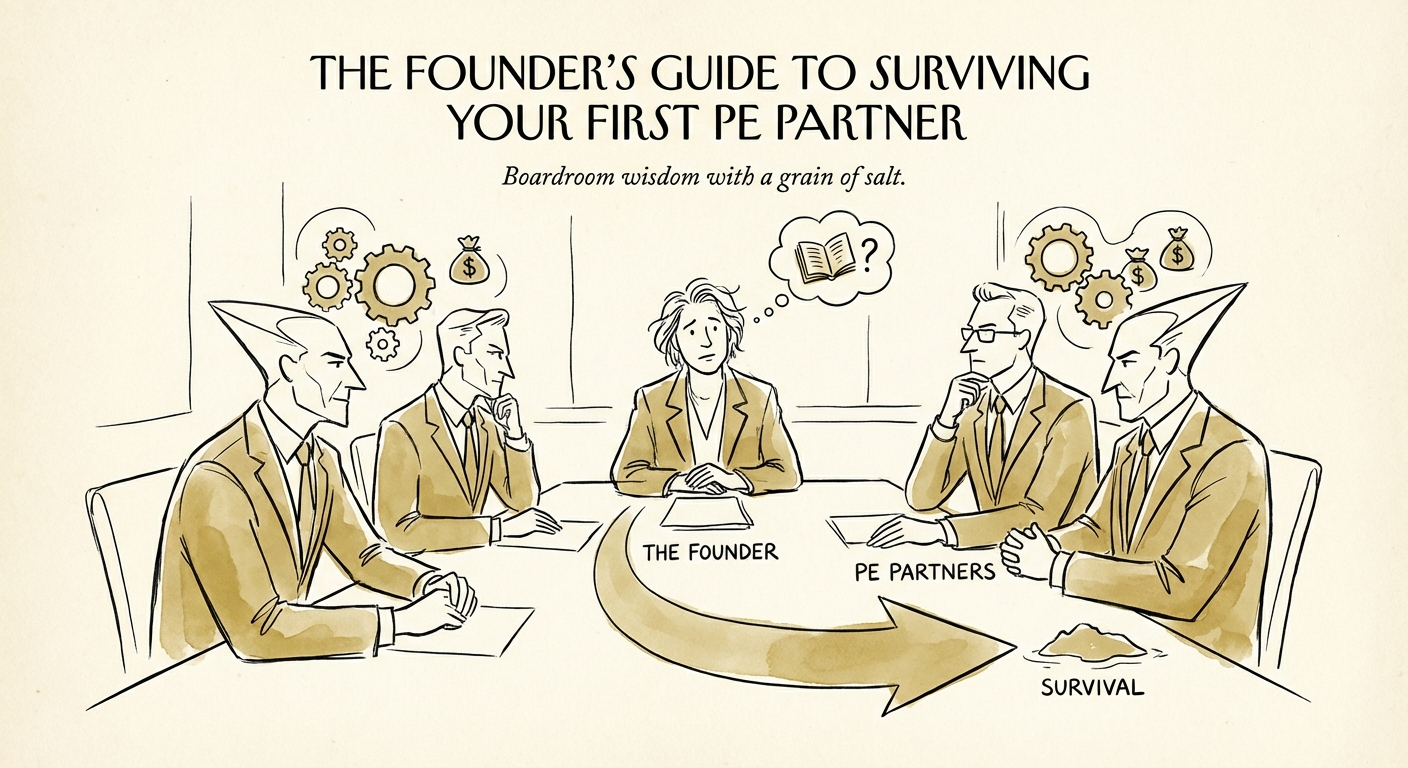
The Founder's Guide to Surviving Your First PE Partner
58% of founder CEOs are replaced within two years of a PE deal. Learn the operational playbook to survive the transition, align with the board, and drive multiple expansion.
58% Founder Replacement Rate (2 Years)
BRIEF · FOUNDER EXTRACTION
The Founder's Last 100 Days: Preparing Yourself for Life After Exit
75% of founders regret their exit within one year. This diagnostic guide prepares you for the operational and psychological shift of life after the deal.
75% Founder Regret Rate
BRIEF · FINANCIAL INFRASTRUCTURE
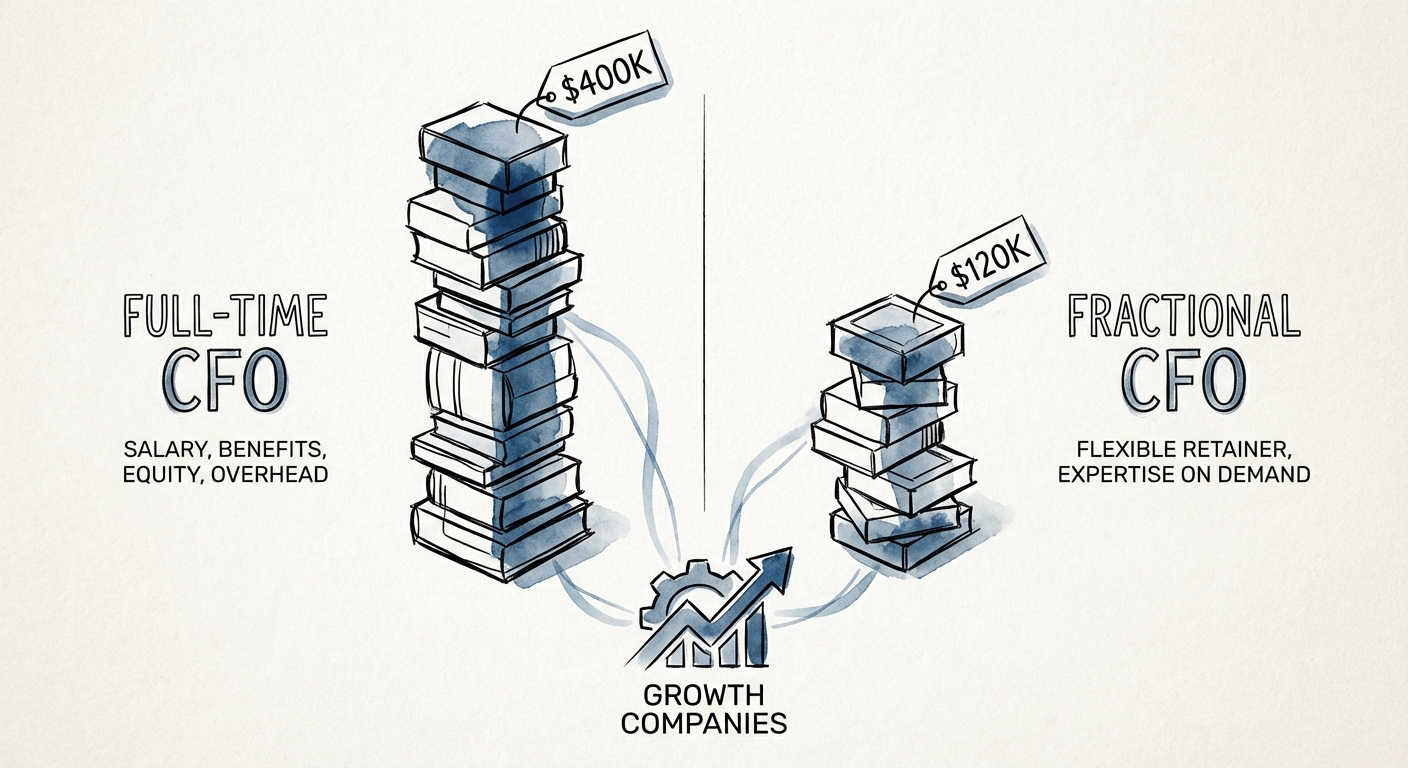
Fractional CFO vs. Full-Time CFO: The $10M-$50M ARR Timing Trap
A $400k full-time CFO hired at $15M ARR will reconcile invoices and resent you for it. Here's the utilization math and the scorecard for the switch.
$280,000 Avg. Annual Savings
BRIEF · PROCESS DOCUMENTATION
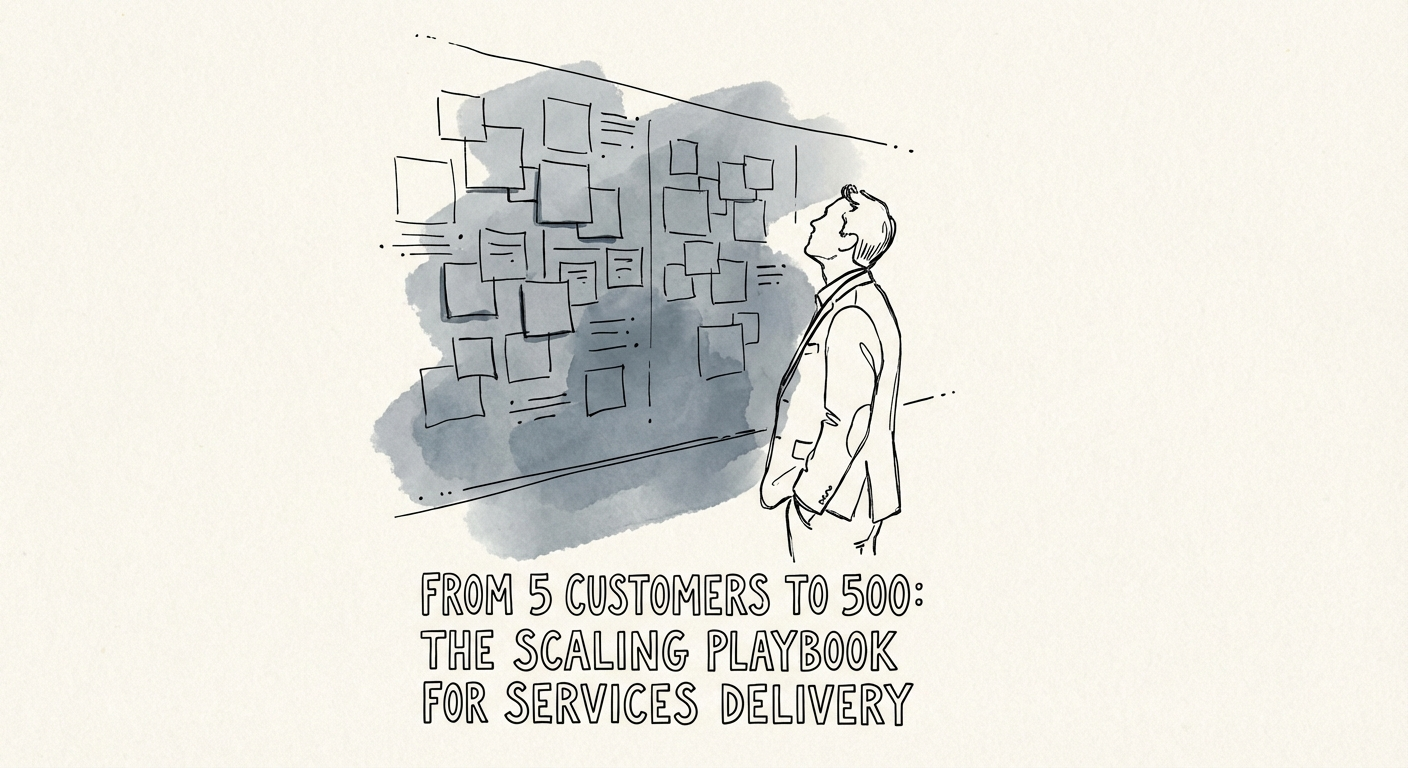
The Founder Bottleneck: Why Your Delivery Model Breaks at 50 Customers
Your delivery worked at 5 customers because you were the product. Here's the exact point it breaks, the 537% margin gap that proves it, and what to fix first.
537% Higher Profit Margins for Process-Mature Firms
BRIEF · PROCESS DOCUMENTATION
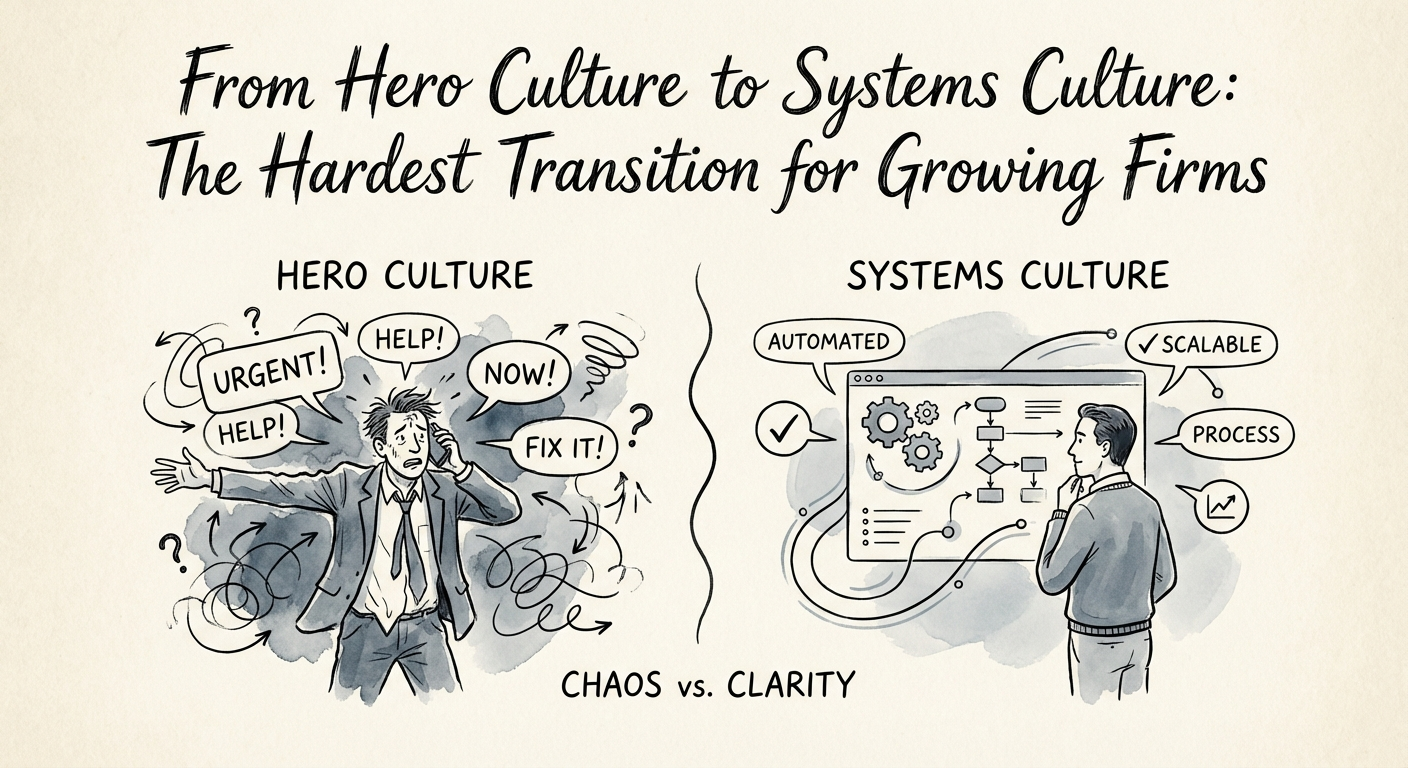
The Hero Tax: Why Your 'Genius' Is Costing You a 50% Valuation Haircut
Founder dependency costs companies a 30-50% valuation haircut. Learn how to transition from heroics to systems and reclaim 9.3 hours/week per employee.
30-50% Valuation Haircut
BRIEF · PROCESS DOCUMENTATION
From Reactive to Proactive: The CIO’s Guide to Killing the 'Hero Culture'
Reactive IT organizations suffer 3.3x more downtime and bleed $1.4M per hour in outages. Here is the operational maturity roadmap for enterprise CIOs stuck in firefighting mode.
3.3x More Downtime in Reactive Orgs
BRIEF · PROCESS DOCUMENTATION
The Founder Bus Test: Why Undocumented Process Costs You a Full Turn of EBITDA
A diligence team asks one question your team can't answer without you in the room. Here's how to document a B2B tech & services firm into a higher exit multiple.
30% Of Employee Time Spent Searching
BRIEF · UNIT ECONOMICS
62 in the Pack, 78 in the CIM: Closing the Gross-Margin Gap on a PE SaaS Asset
The CIM said 78% gross margin. The first monthly pack says 62. Here's how PE operators bridge the gap on a B2B SaaS asset, line by line, before the next raise.
105% Valuation Premium for >80% GM Firms