BRIEF · GTM EXECUTION
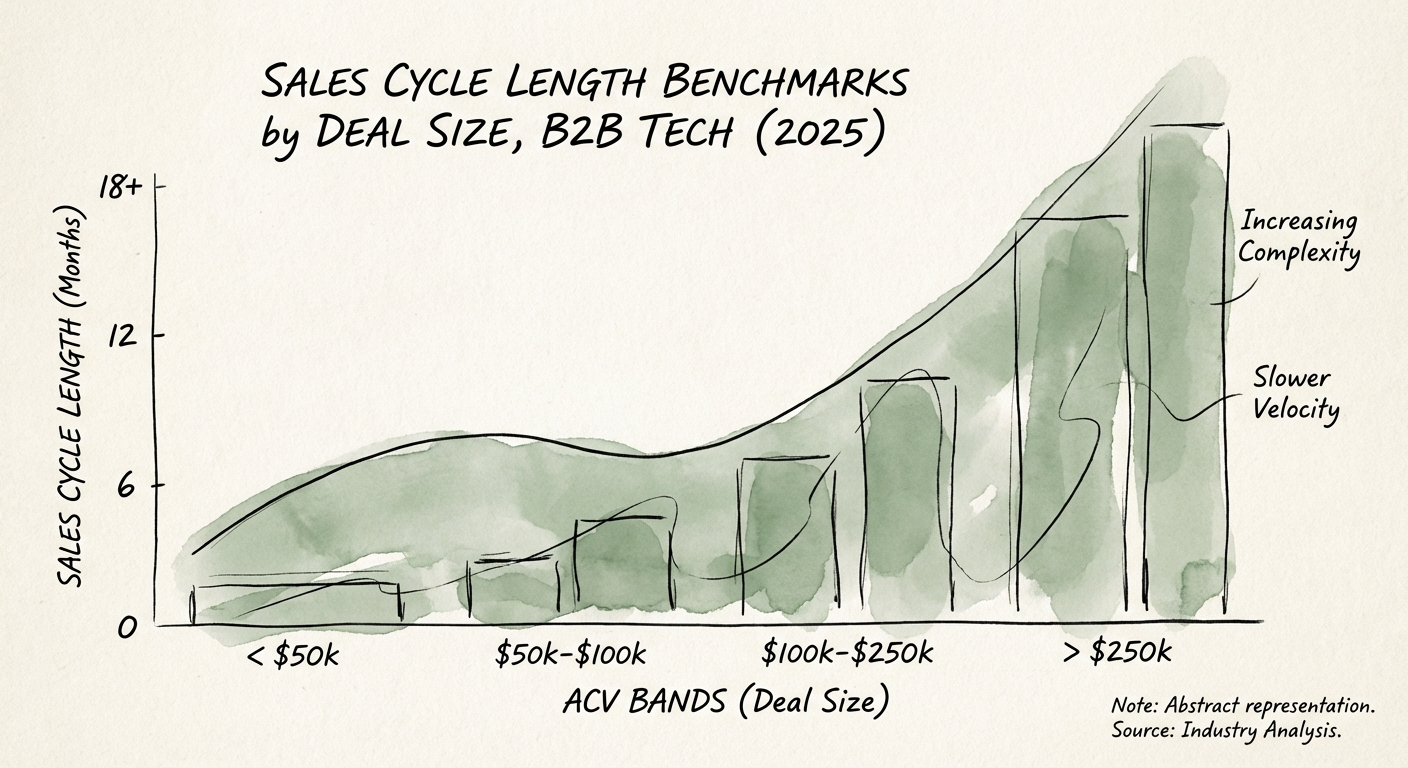
The New Speed of Revenue: 2025 Sales Cycle Benchmarks by Deal Size
2025 sales cycle benchmarks by ACV. Deals $50k-$100k now average 120 days. Compare your velocity against median B2B tech performance.
120 Days Median Cycle ($50k-$100k ACV)
BRIEF · FINANCIAL INFRASTRUCTURE
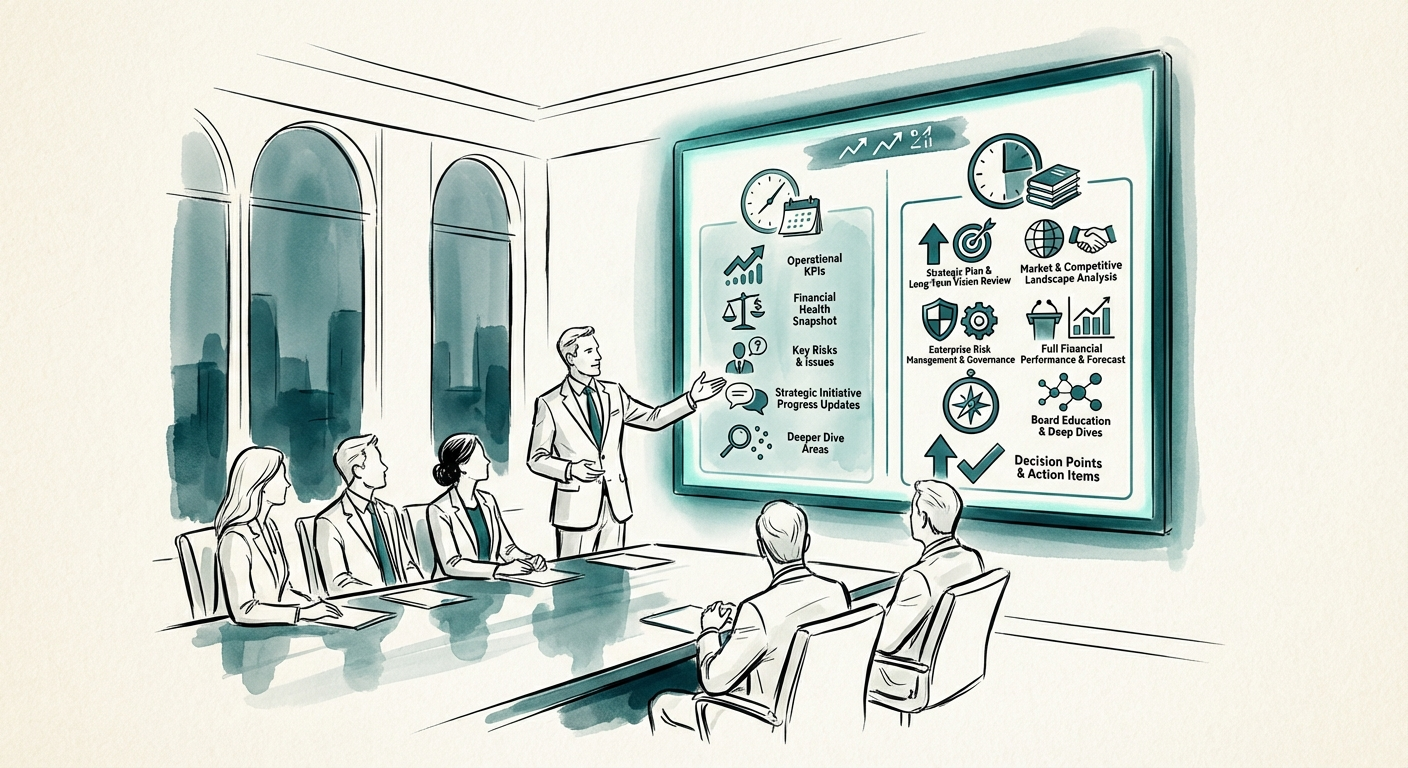
Monthly Flash vs. Quarterly Board Deck: What Actually Belongs in Each
A Series B founder's split between a one-page monthly flash and a strategic quarterly deck — with the 2025 benchmarks your board already knows by heart.
95% Forecast Accuracy Target
BRIEF · FINANCIAL INFRASTRUCTURE
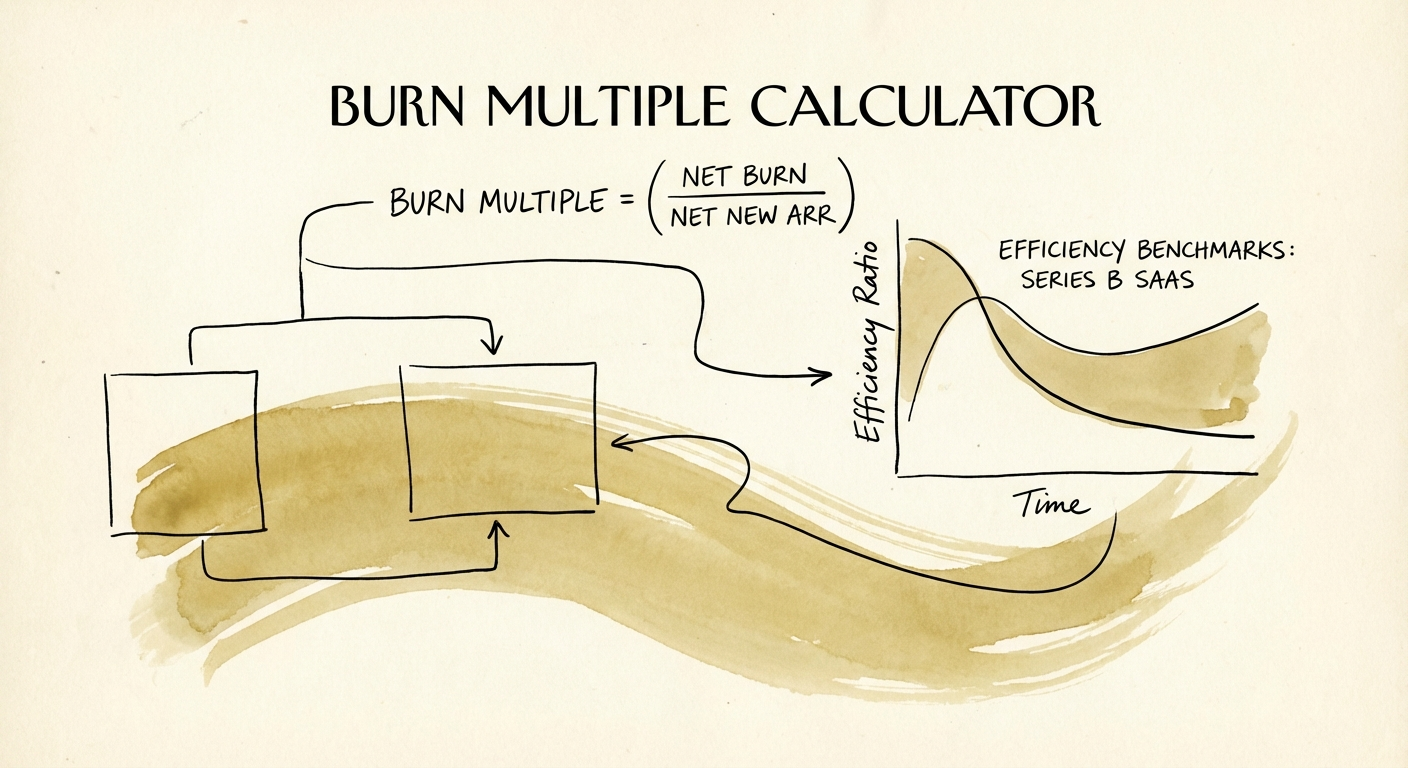
Burn Multiple Formula and Benchmarks for VC-Backed SaaS
Use the Burn Multiple formula to evaluate capital efficiency in 2026. See why investors scrutinize companies above 1.5x at the Series B stage.
1.5x Max Burn Multiple for Series B
BRIEF · FINANCIAL INFRASTRUCTURE
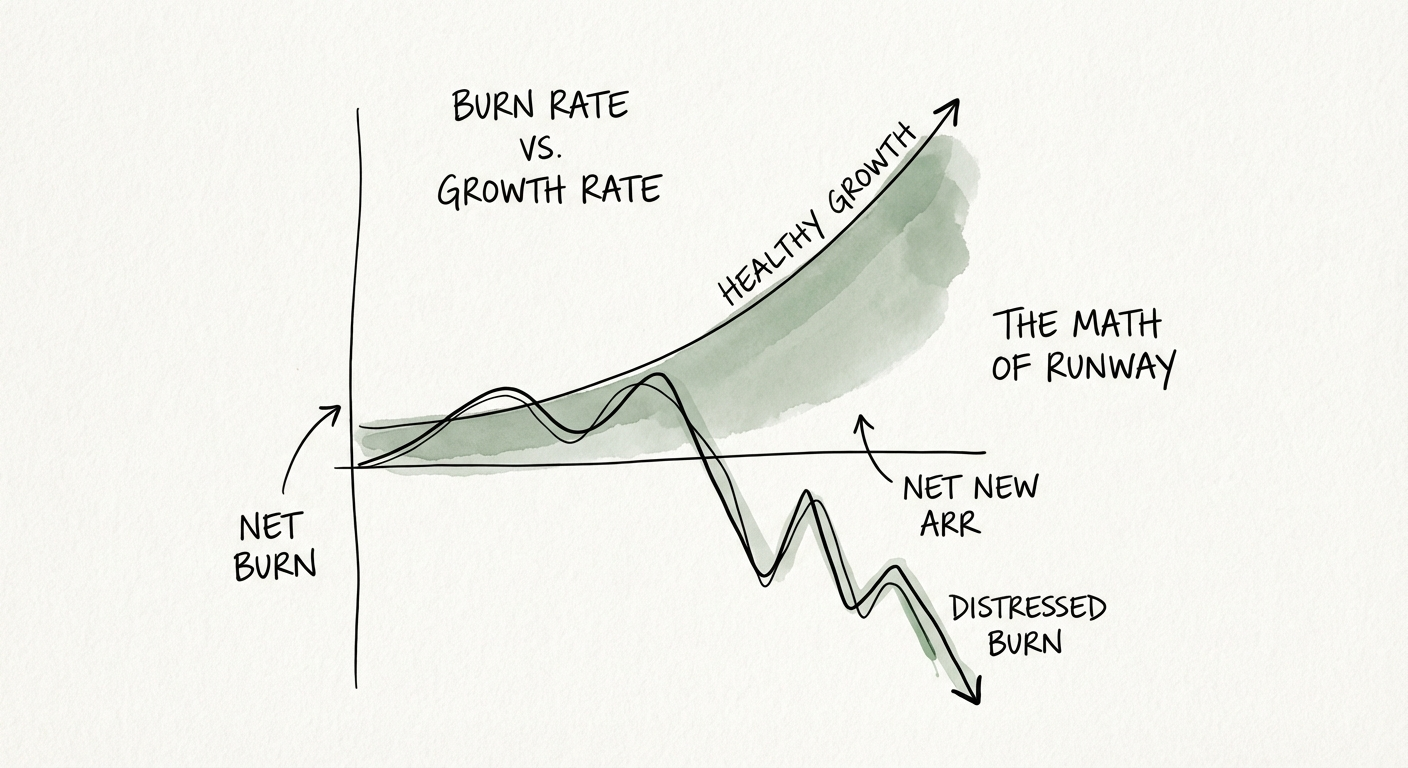
Burn Rate vs. Growth Rate: The Math That Determines Your Runway
Stop tracking vanilla burn rate. In 2025, the Burn Multiple is the only efficiency metric that matters. Here are the benchmarks for Series B survival.
1.5x Max Burn Multiple (Series B)
BRIEF · UNIT ECONOMICS
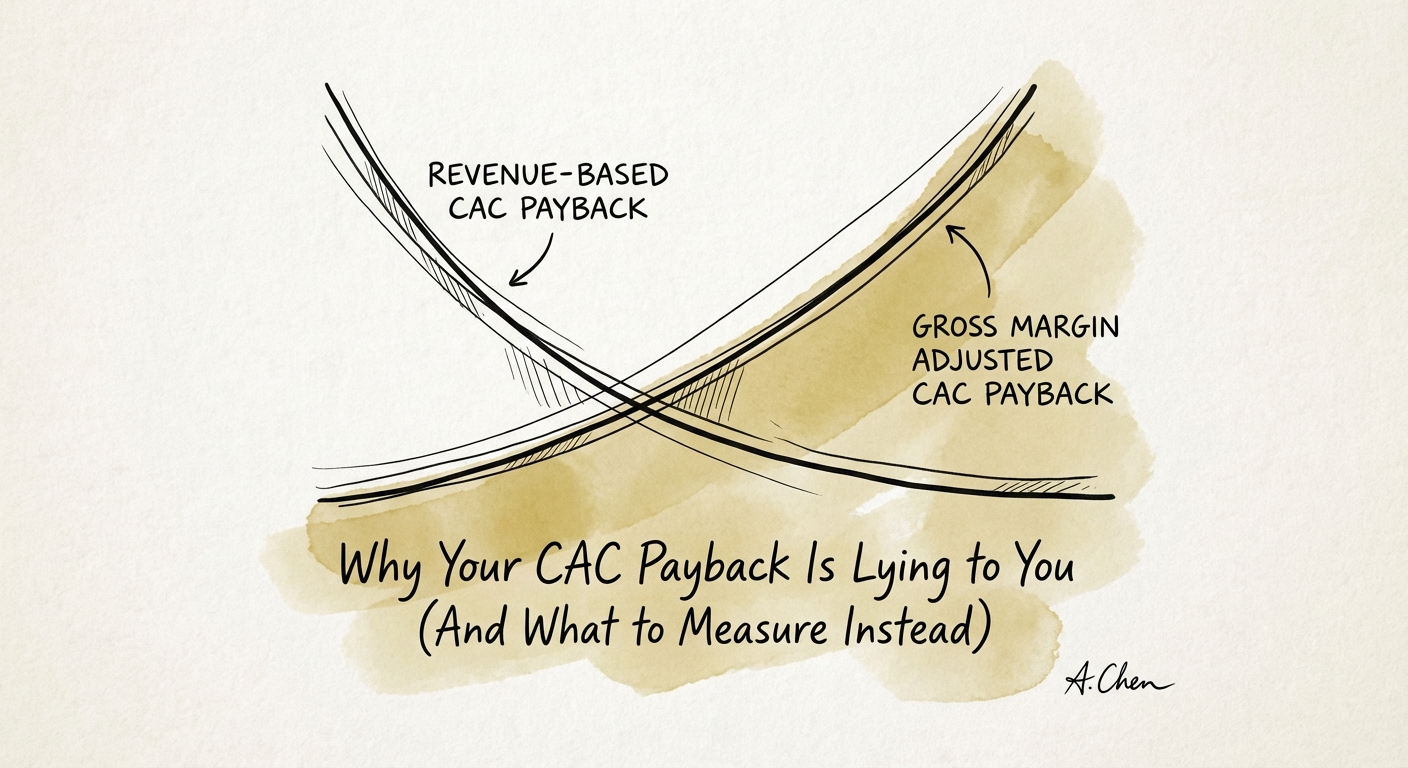
Why Your CAC Payback Is Lying to You (And What to Measure Instead)
Median B2B SaaS CAC Payback is now 15 months. If you calculate it without Gross Margin, you're underestimating risk by 30%. Here is the correct formula.
15 Months Median B2B Payback
BRIEF · TEAM & HIRING
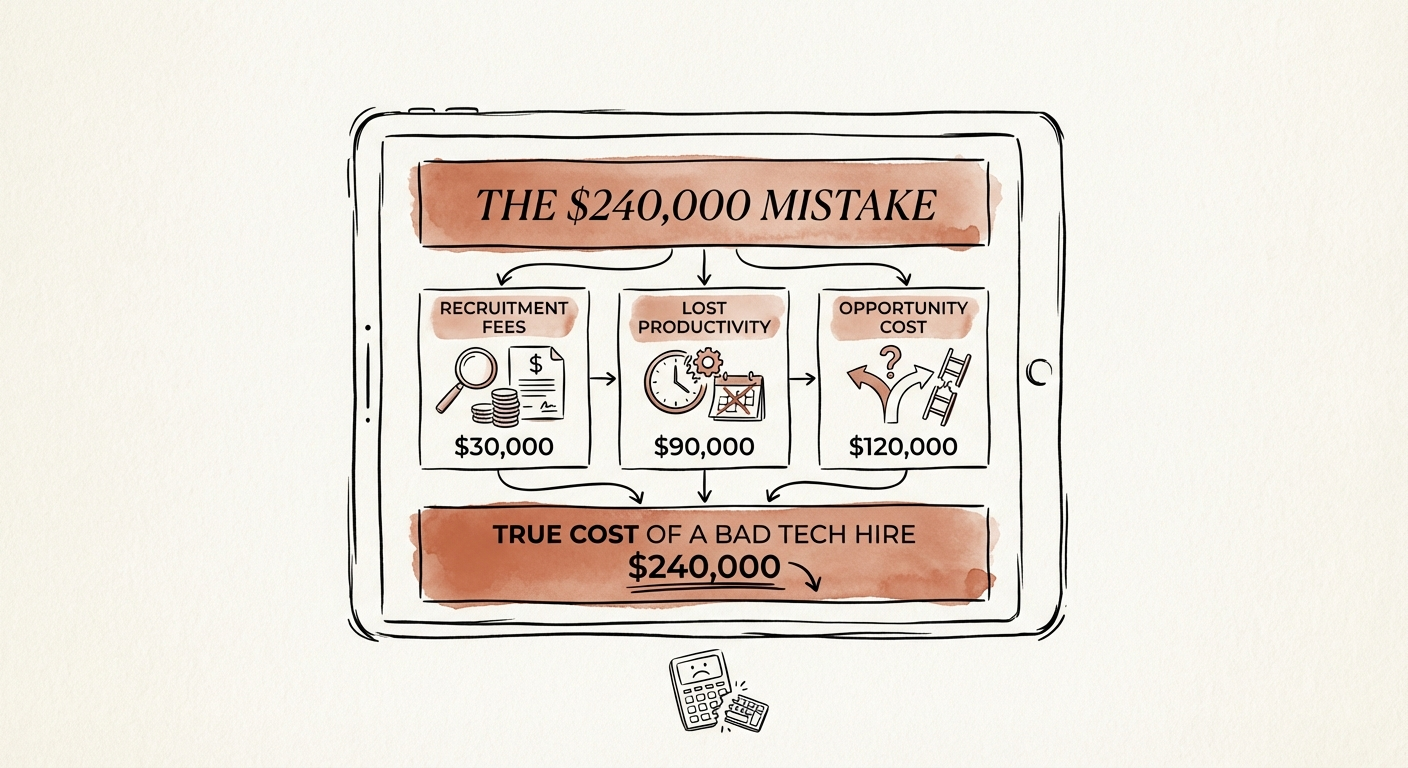
Your Backend Hire Quit Day 180. Here's the Real Number — And It Isn't Their Salary.
A failed Series B engineering hire rarely costs the salary you paid. Here's the four-bucket forensic math — and why the real number clears $240K.
$240,000 Avg. Cost of Bad Tech Hire
BRIEF · MIGRATION & INTEGRATION
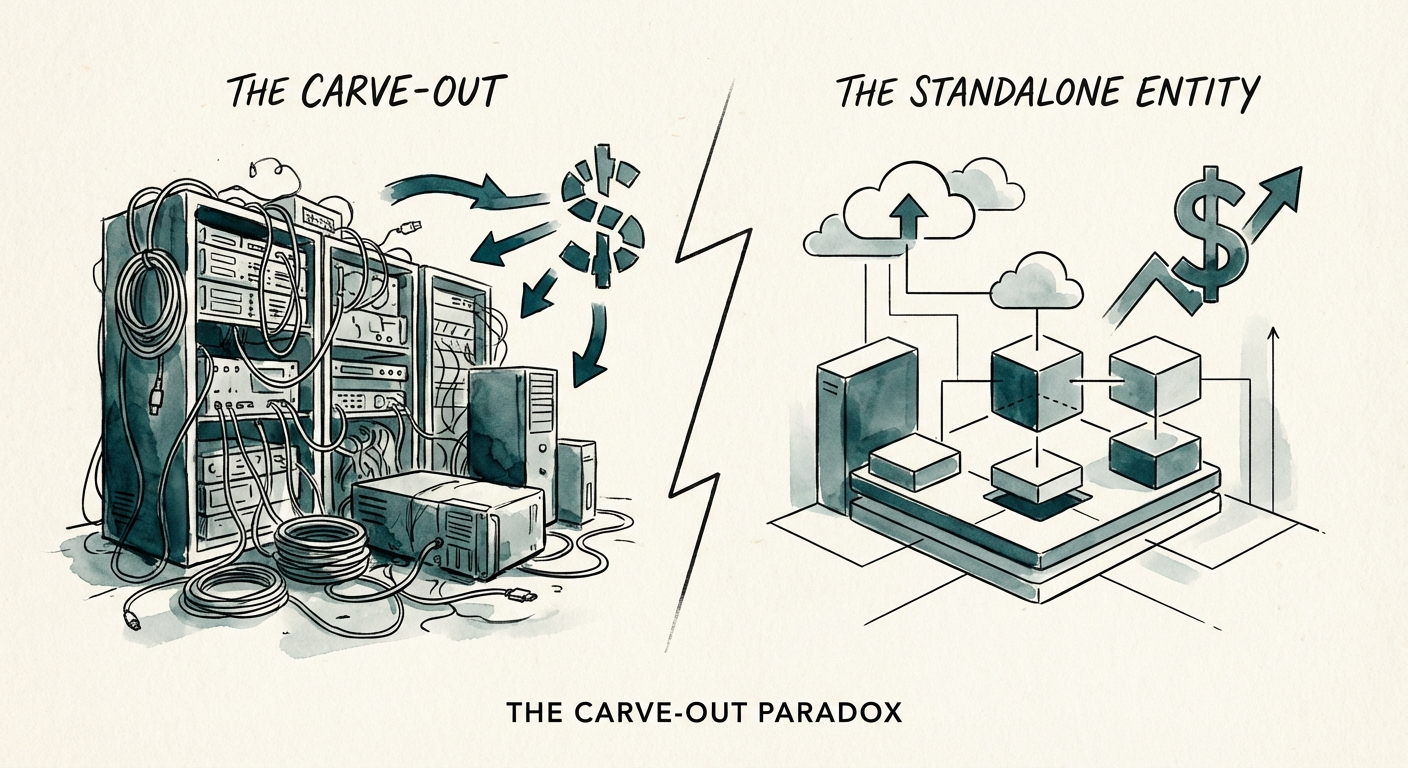
The Carve-Out Paradox: Why "Cheaper" Assets Cost 3x More to Integrate
Carve-outs trade at lower multiples but carry higher risks. Data shows average carve-out MOIC has dropped to 1.5x. Here is the operational playbook to avoid the TSA trap.
1.5x Avg. Carve-Out MOIC (vs 1.8x Buyout)
BRIEF · COMPLIANCE & SECURITY
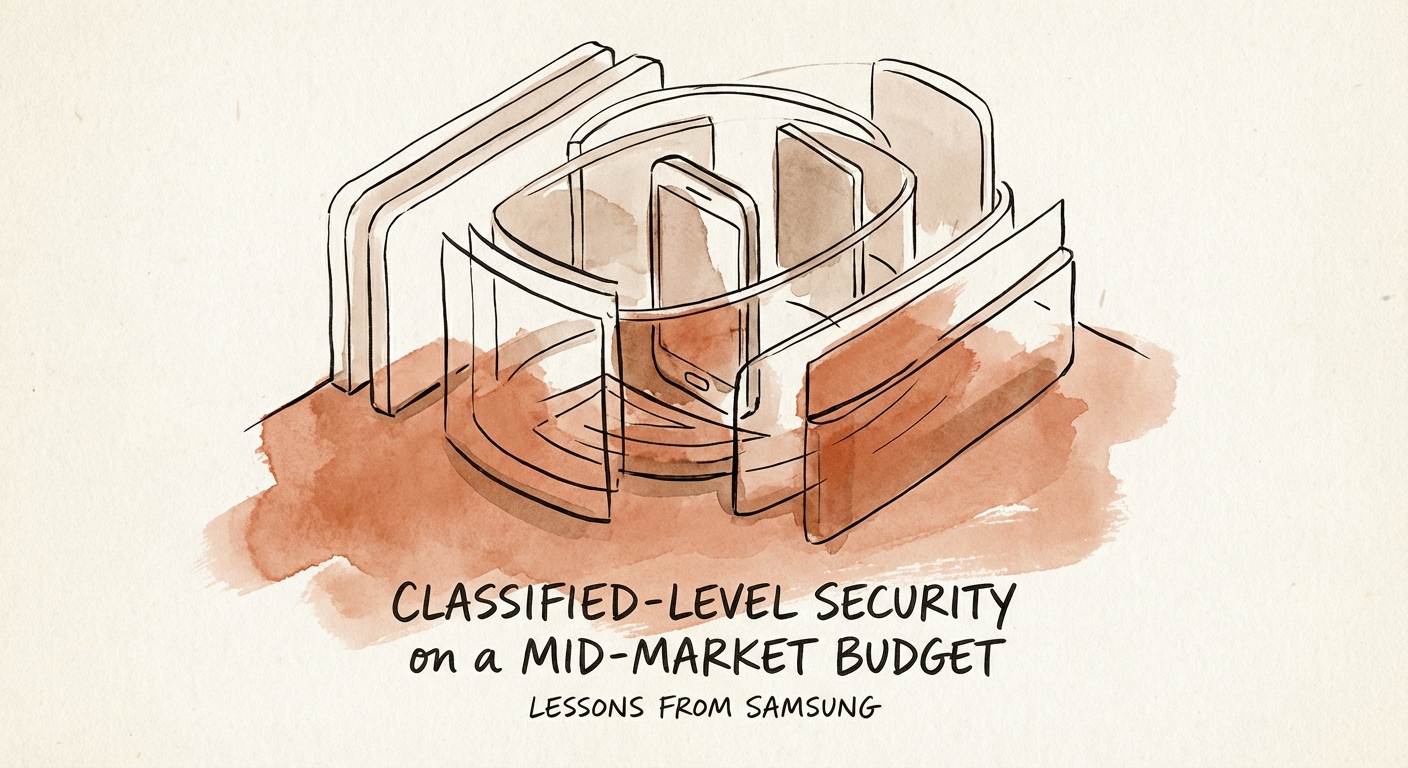
Classified-Level Security on a Mid-Market Budget: Lessons from a Semiconductor Fab
How mid-market CIOs can achieve defense-grade security without a defense-grade budget. Lessons from a semiconductor fab's NSA CSfC approval and the shift to layered commercial security.
$233,000 Avg. CMMC Level 2 Prep Cost (Mid-Market)
BRIEF · MIGRATION & INTEGRATION
Cloud Migration Cost Overruns: Why Estimates Miss
Cloud budgets often miss the real cost of migration. See how egress, dual-run periods, skills gaps, and weak FinOps controls create overruns.
72% CIOs Exceeding Cloud Budgets
BRIEF · COMPLIANCE & SECURITY
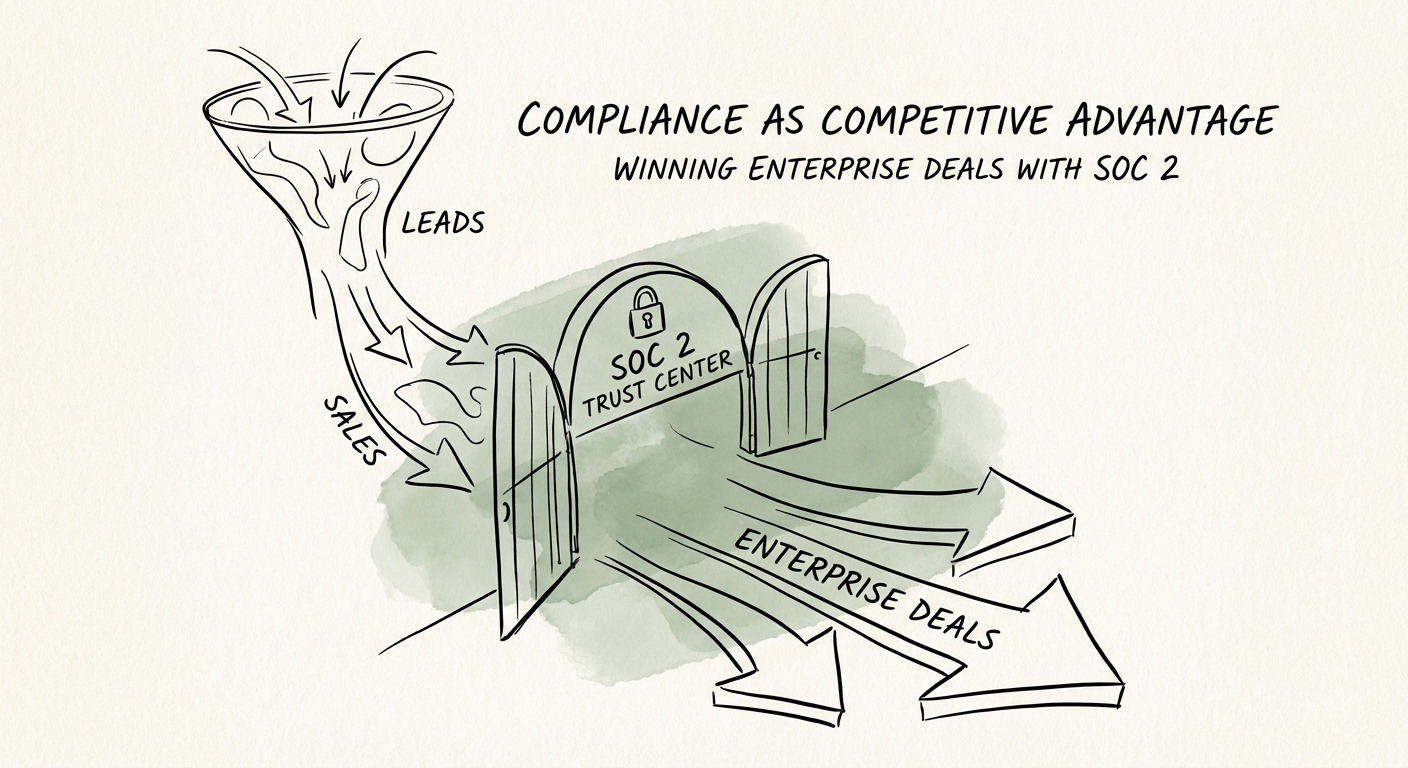
Compliance as Competitive Advantage: Winning Enterprise Deals with SOC 2
Stop treating SOC 2 as a cost center. New 2025 data shows compliance-ready firms see 28% faster sales cycles. Here is the CEO's guide to using security.
28% Faster Sales Cycles

BRIEF · COMPLIANCE & SECURITY
The Compliance Debt Trap: Why 'Check-the-Box' Governance Kills Exits
Avoid the $350M mistake. A diagnostic compliance checklist for PE Operating Partners to assess portfolio readiness before the exit window opens.
$350M Deal Value Reduction
BRIEF · REVENUE ARCHITECTURE
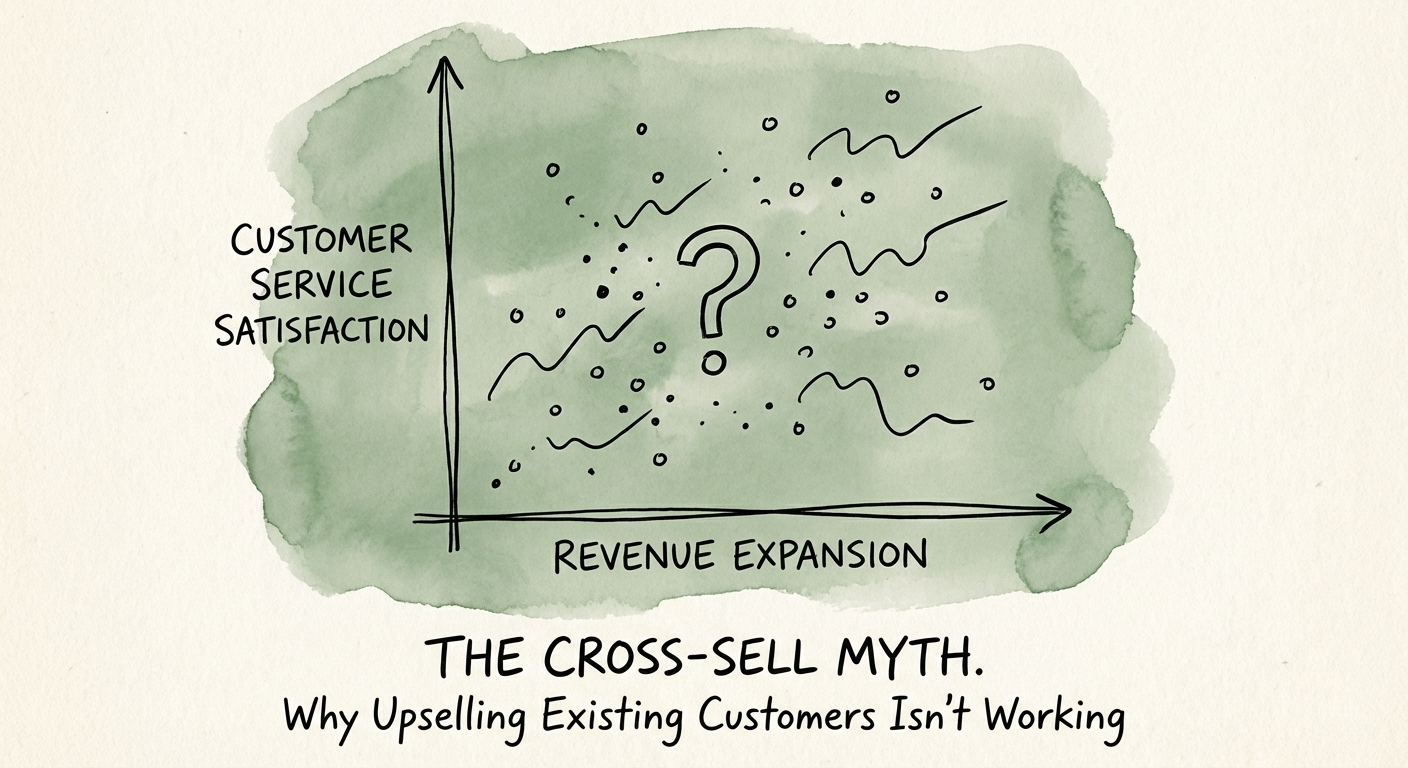
The Cross-Sell Myth: Why Your Happiest Customers Spend the Least
88% of account managers think great service drives expansion. The correlation is zero. Here's why Series B/C SaaS stalls at 101% NRR and the fix.
0% Correlation Between Service Quality & Account Growth
BRIEF · EXIT READINESS
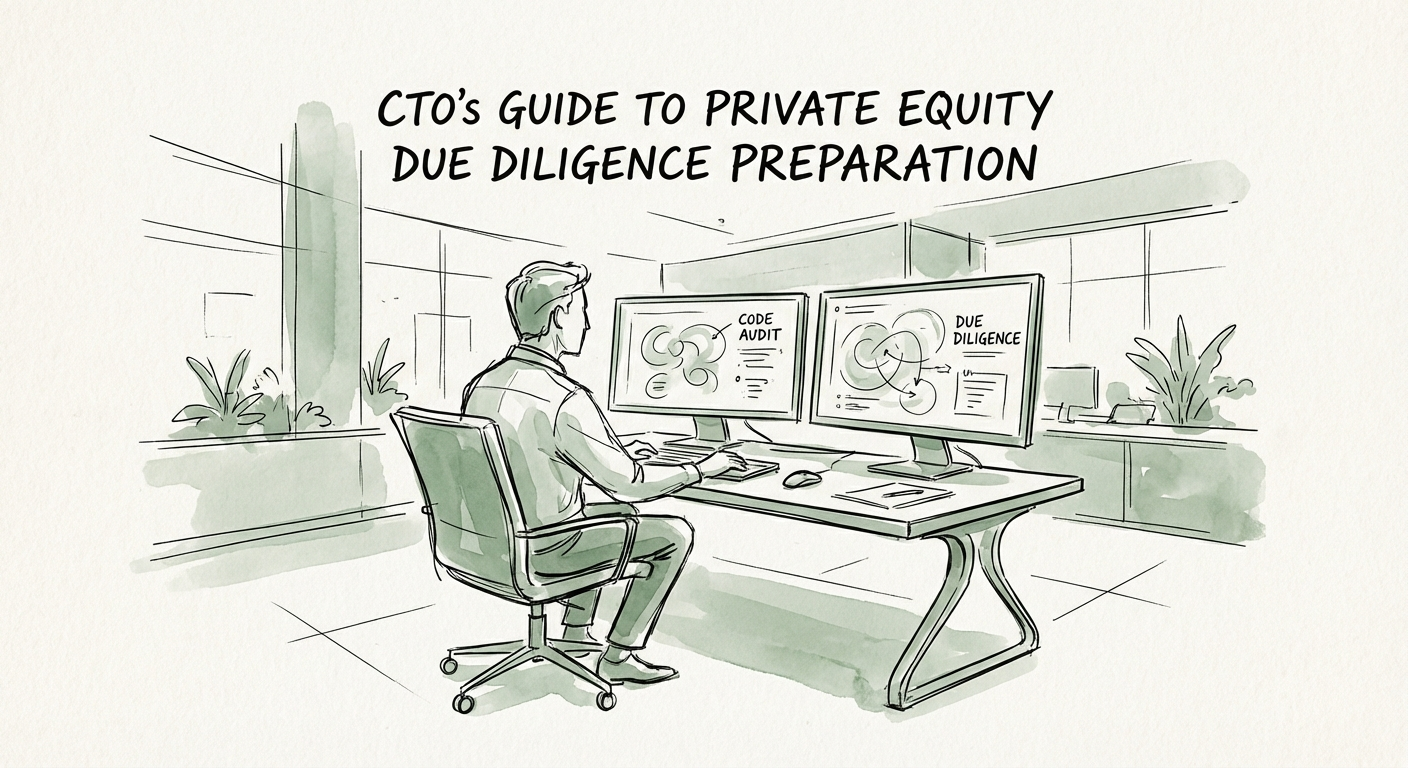
The CTO’s Guide to Private Equity Due Diligence: Surviving the 2026 Technical Audit
Tech due diligence has changed. In 2025, 96% of audited codebases contained high-risk vulnerabilities. Here is the CTO's guide to passing the PE audit.
96% Codebases with Unpatched Vulnerabilities (2025 OSSRA)

BRIEF · EXIT READINESS
The Customer Concentration Analysis Framework for Acquirers
A diagnostic framework for acquirers to assess customer concentration risk. How to stress-test 'Whale' accounts and structure deals to mitigate the 20-30% valuation discount.
30% Valuation Discount
BRIEF · REVENUE ARCHITECTURE
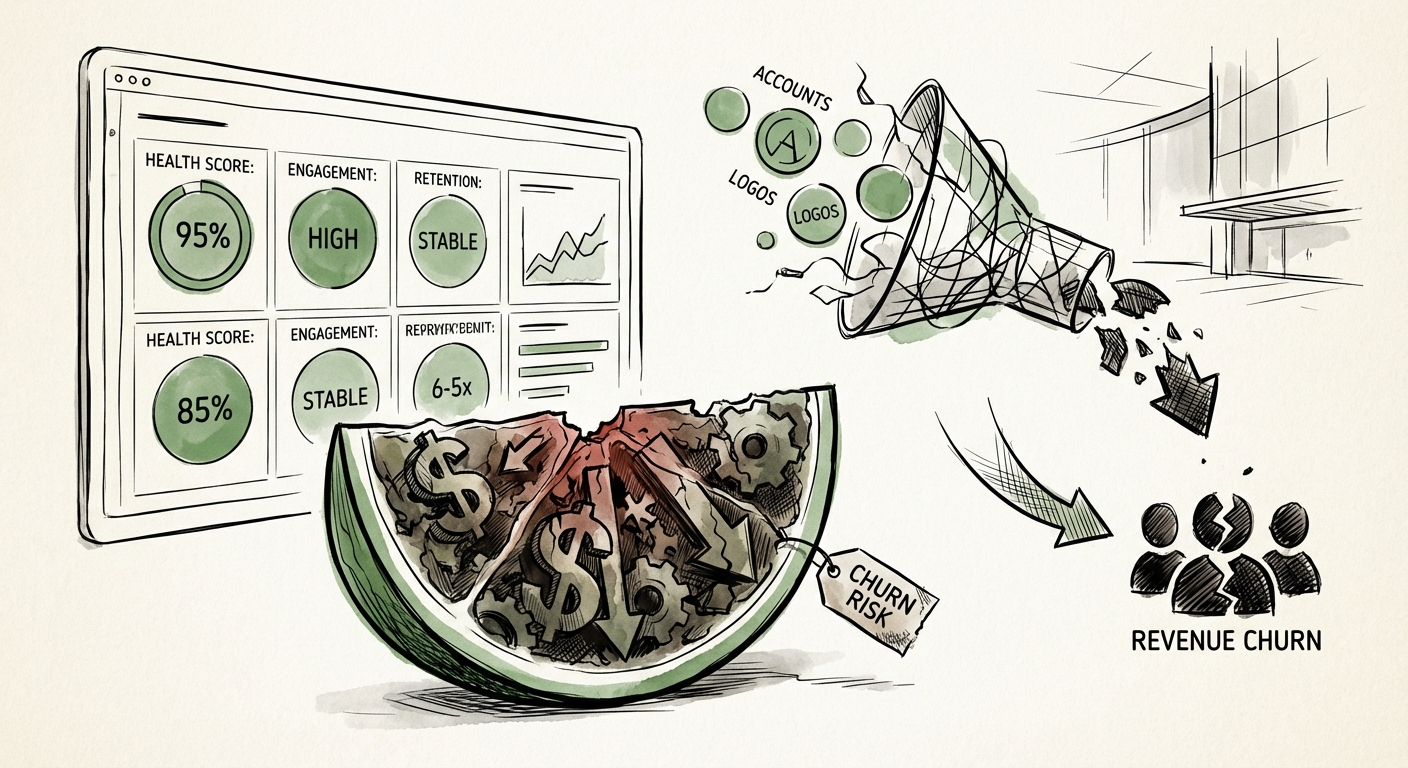
The Watermelon Effect: Why Your 'Green' Accounts Keep Churning (And How to Fix It)
Stop being blindsided by 'green' account churn. A diagnostic guide to building a predictive customer health score that actually correlates to revenue, not just sentiment.
46% Firms using Health Scores for Forecasting
BRIEF · REVENUE ARCHITECTURE
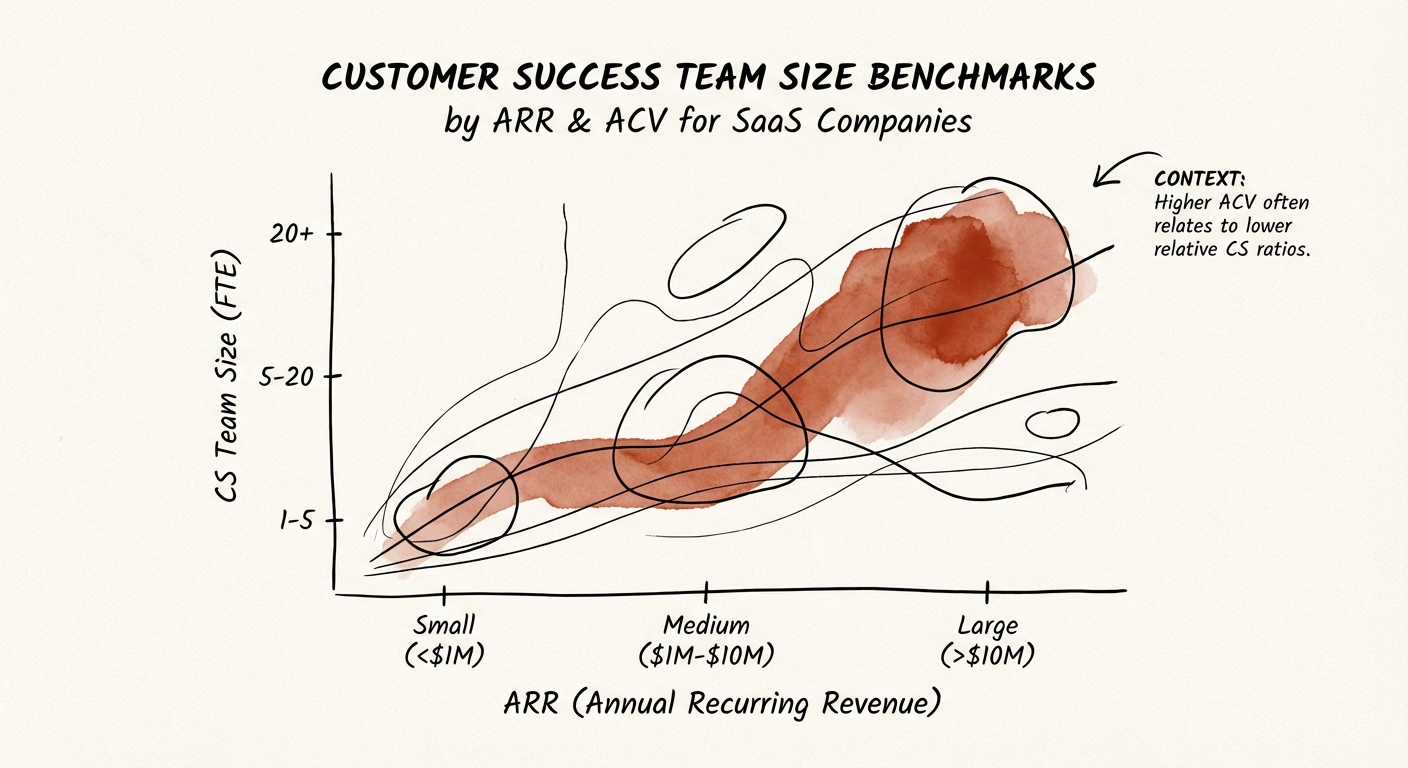
Customer Success Team Size Benchmarks: Why You're Likely Overstaffed
2026 CS headcount benchmarks: SaaS firms with $10M-$50M ARR should target $2M-$4M ARR per CSM. Don't hire more bodies—fix your segmentation.
$2M-$4M Target ARR Managed per CSM (Growth Stage)
BRIEF · TECHNICAL DEBT
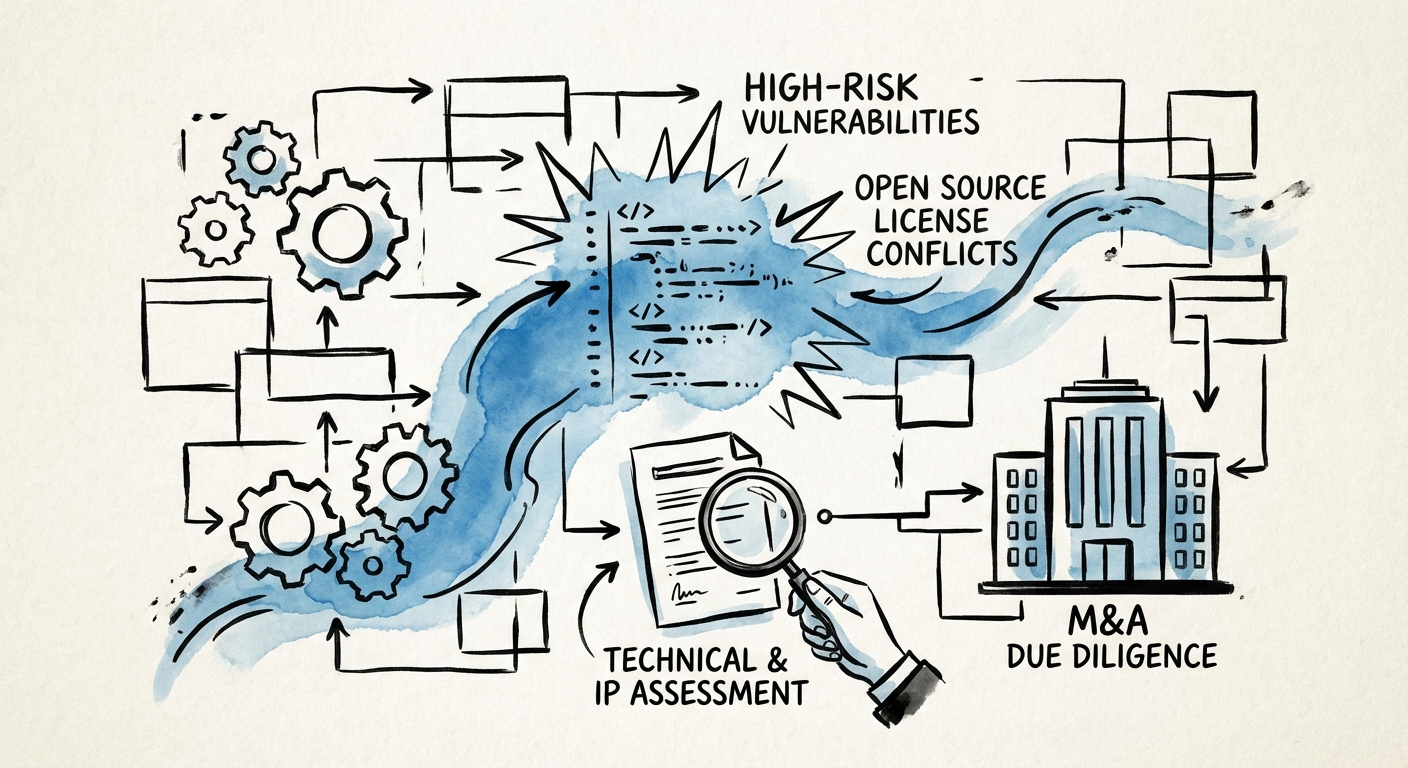
Cybersecurity Due Diligence: When the Security Vendor's Own Code Is the Risk
Buying a cybersecurity firm? 74% of codebases carry high-risk flaws. The SBOM, encryption-engine provenance, and IP checks that decide the deal before close.
74% Codebases with High-Risk Vulnerabilities
BRIEF · MIGRATION & INTEGRATION
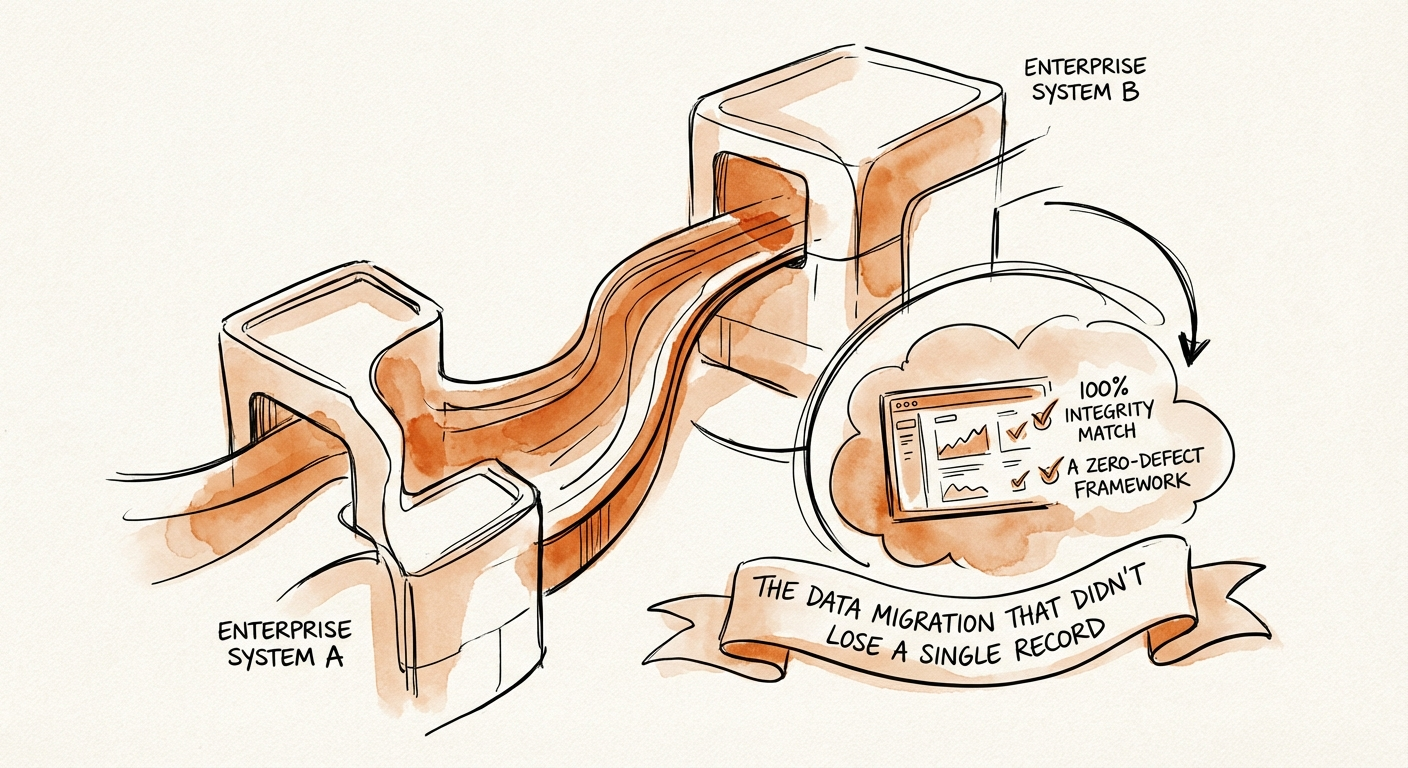
The Data Migration That Didn't Lose a Single Record: A Zero-Defect Framework
Learn the Zero-Defect Framework that protects data integrity, reduces downtime risk, and prevents missing-record support issues.
0% Data Loss
BRIEF · TECHNICAL DEBT
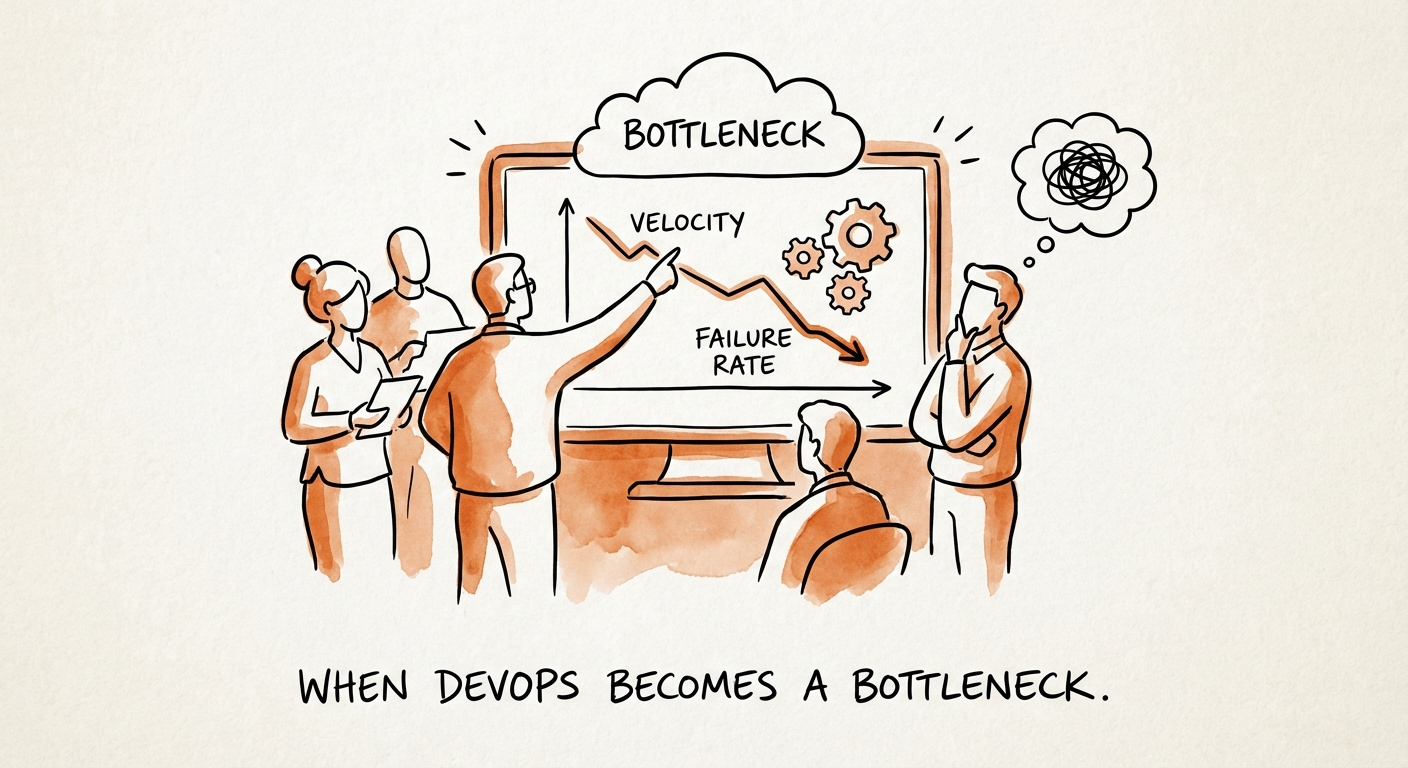
You Doubled Engineering and Velocity Fell. The Bottleneck Isn't Your Engineers.
You went from 15 engineers to 30 and shipping got slower. Here's the queue math behind the Series B velocity stall in B2B SaaS — and how to clear it.
33% Wasted Developer Time

BRIEF · PROCESS DOCUMENTATION
The Two-Week Window: Documenting Tribal Knowledge Before a Key Employee Walks
A senior engineer just resigned and owns the billing integration nobody else understands. Here is the operator's protocol for the 10 working days you have left.
42% Unique Institutional Knowledge
BRIEF · EXIT READINESS
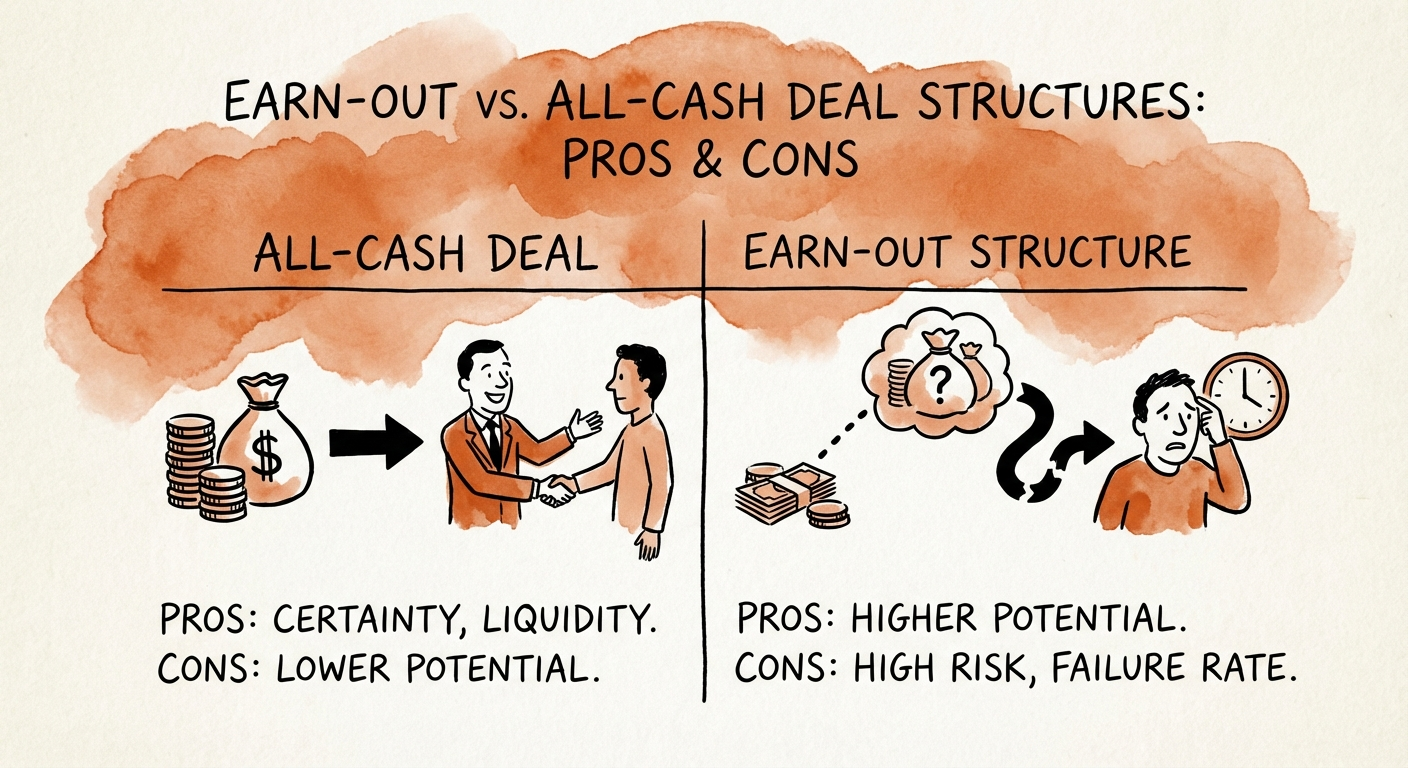
Earnout vs. All-Cash: The 21-Cent Math Every B2B Tech Founder Gets Wrong
A $50M offer with a $15M earnout is often worth less than a $40M all-cash one. The 2025 data on why, and how a B2B tech founder should actually compare LOIs.
$0.21 Avg. Payout per Earnout Dollar
BRIEF · EXIT READINESS
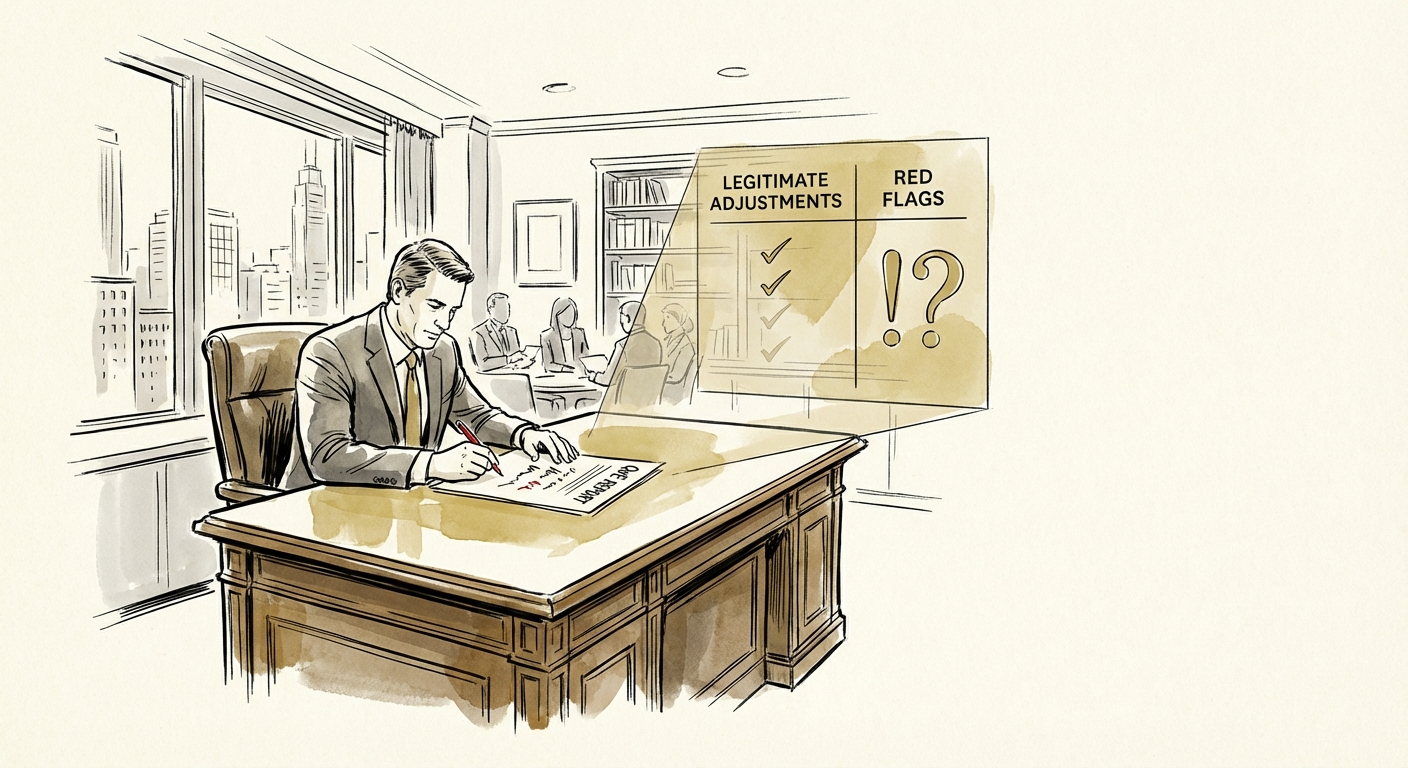
EBITDA Add-Backs: Which Ones Survive a Buyer's QofE, and Which Trigger a Retrade
63% of buyers find material EBITDA discrepancies in diligence. Here's the tier-by-tier read on which add-backs hold under QofE and which cost you a turn of multiple.
63% Buyers Find Discrepancies
BRIEF · TECHNICAL DEBT
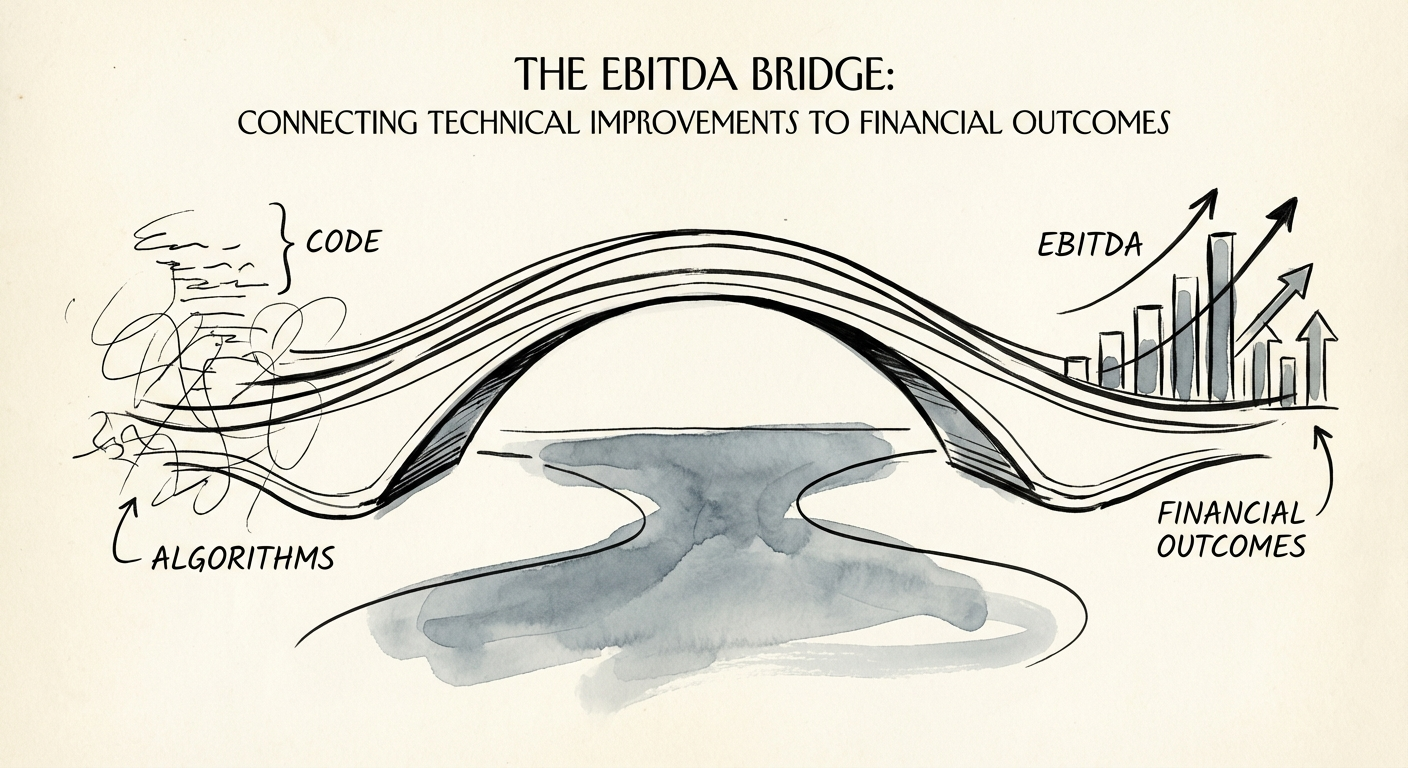
The EBITDA Bridge: Turning a CTO's Tech Debt Into a Number Your IC Will Underwrite
Your CTO says "refactor." Your IC hears "delay." Here's how to convert technical debt into a defensible EBITDA add-back PE sponsors can actually underwrite.
20% Higher Operating Margins
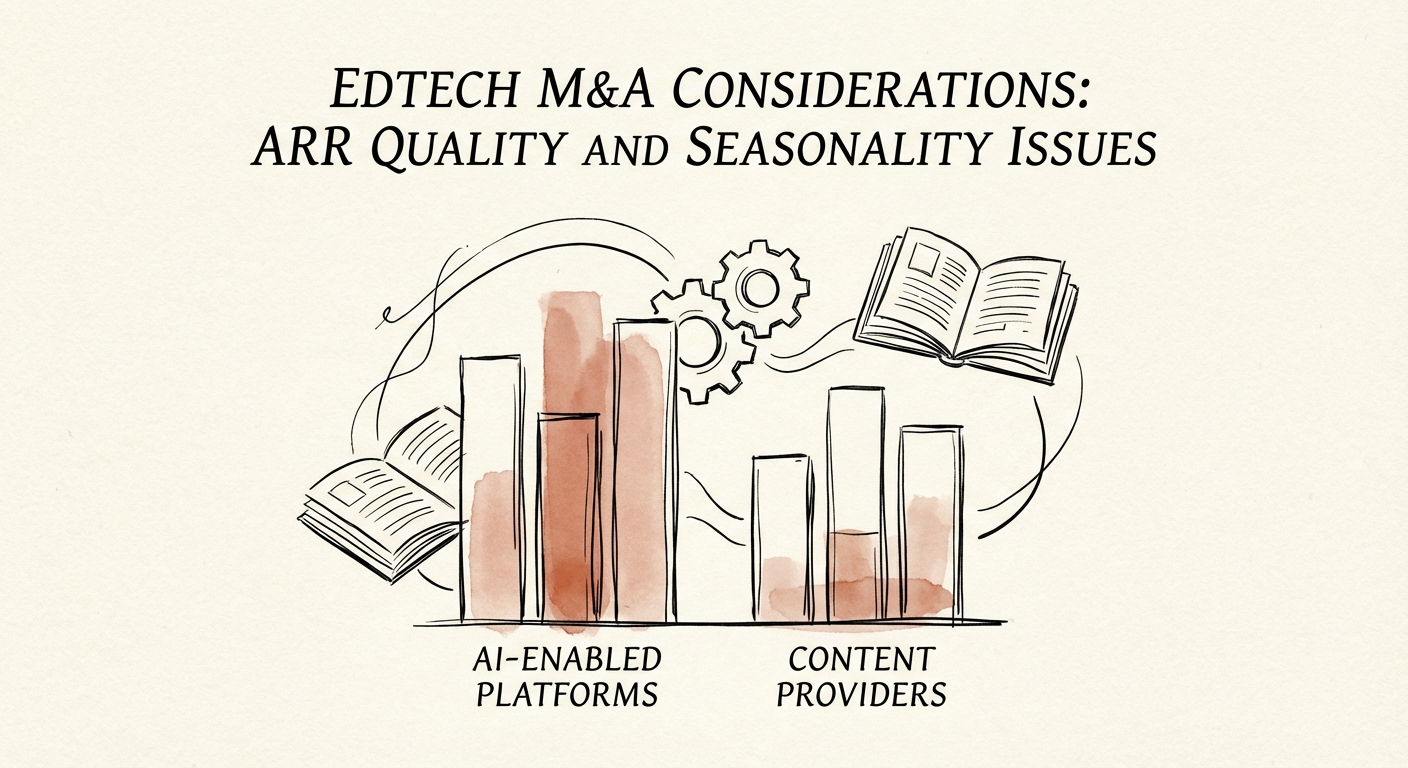
BRIEF · EXIT READINESS
EdTech M&A: The July Payroll Test That Restates Your ARR
In EdTech, a signed district PO isn't recognized revenue. Here's how ASC 606, the summer cash drought, and quiet district shrinkage restate ARR in diligence.
18.6x Top-Decile EV/Revenue Multiple