BRIEF · EXIT READINESS
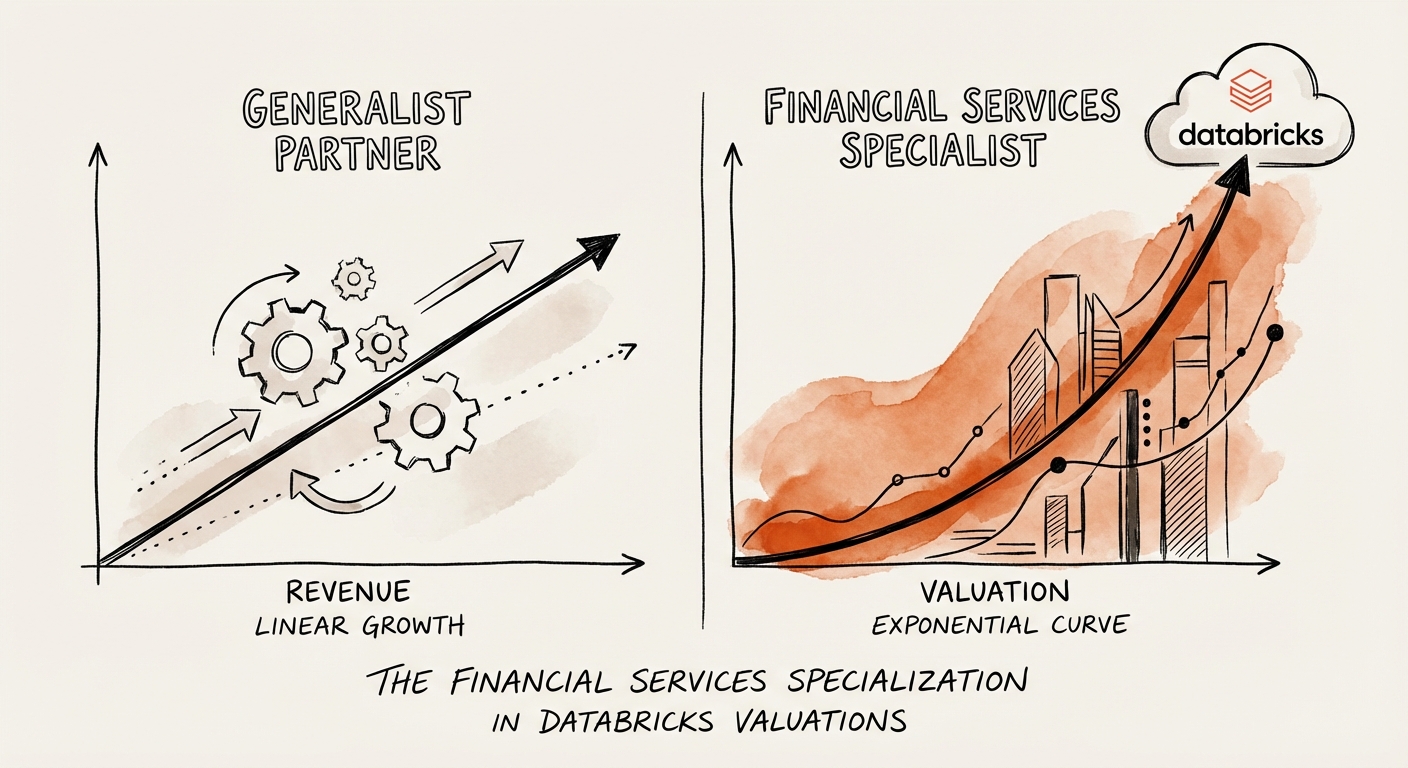
Two Databricks Partners, Same Revenue, Double the Multiple: The Financial Services Premium
Two Databricks partners, identical revenue, one trades at double the multiple. Why FRTB and VaR expertise reprices a financial-services practice at exit.
IP Specialist Valuation Driver
BRIEF · EXIT READINESS
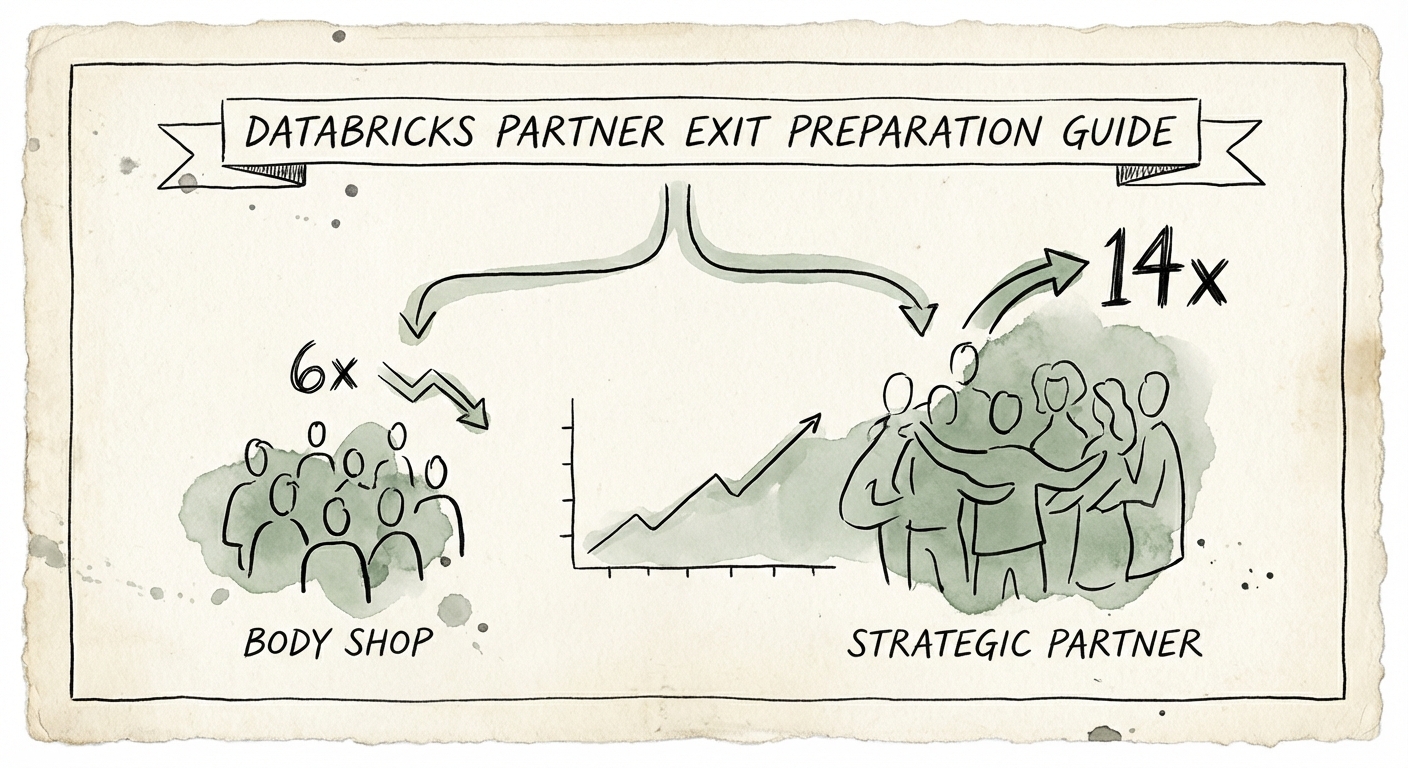
Databricks Partner Exit Preparation: The Gap Between 6x and 14x Multiples
Specialized Databricks partners trade at 14x EBITDA, while generalists stall at 6x. A data-driven exit guide for founders and PE sponsors.
14x EBITDA Multiple for Brickbuilder Partners
BRIEF · FOUNDER EXTRACTION
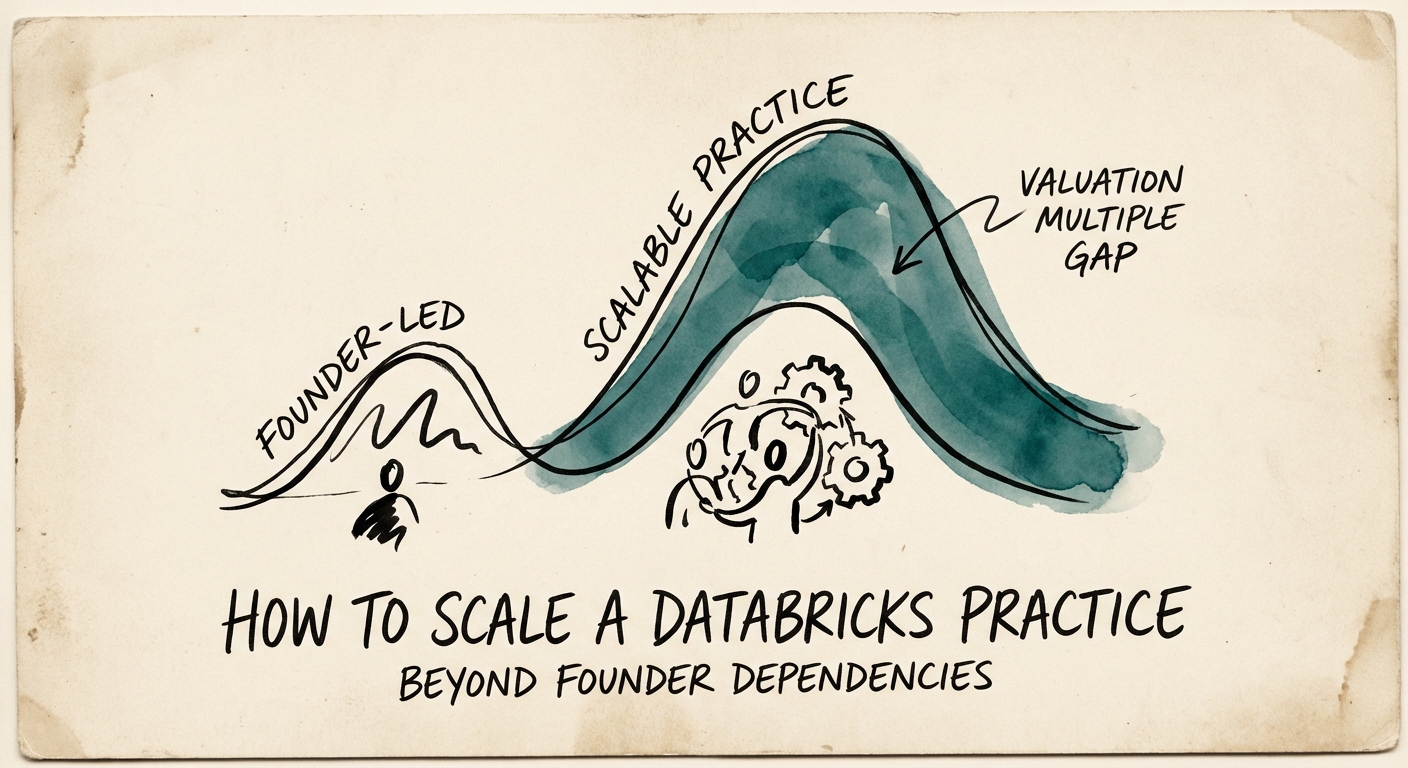
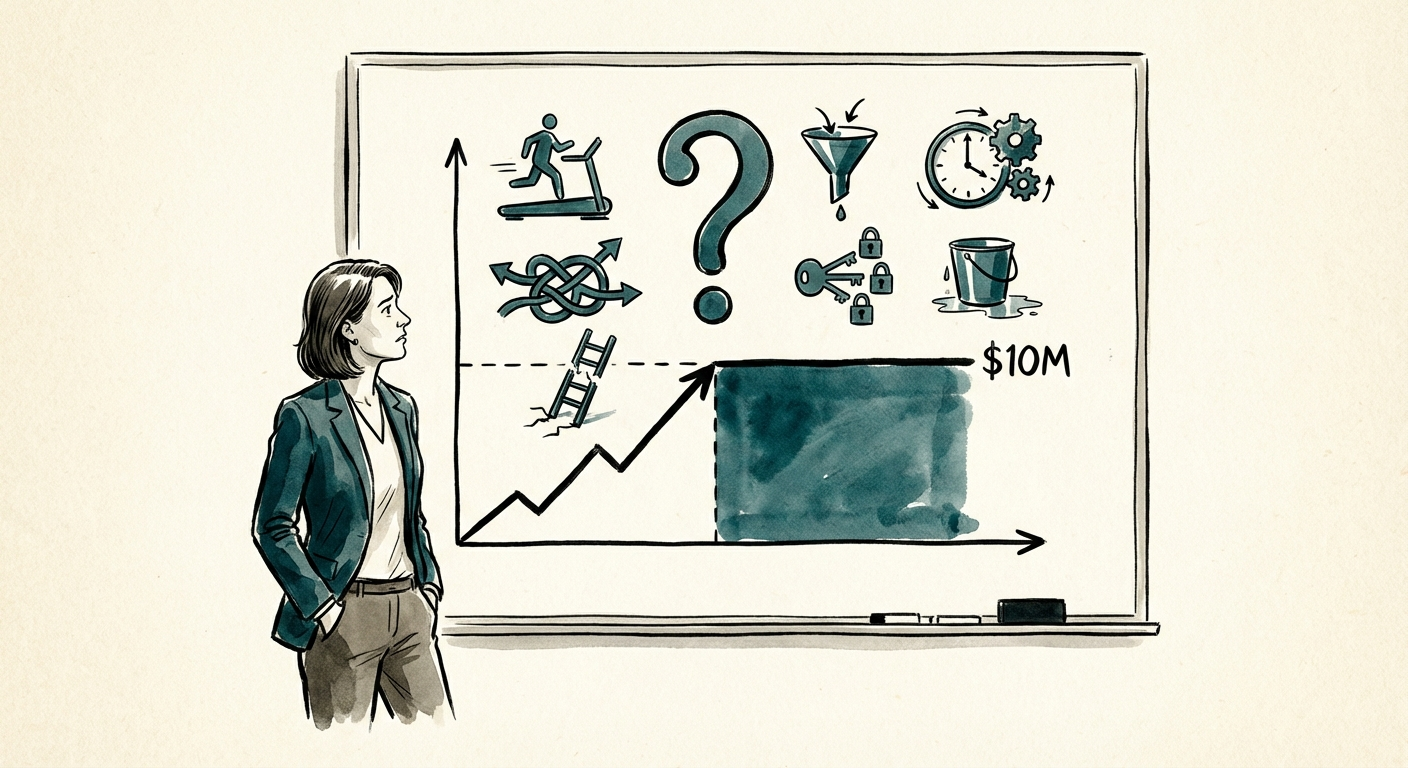
The $10M Databricks Ceiling: How to Scale Your Practice Beyond Founder 'Heroics'
A scaling playbook for Databricks partners hitting the $10M ceiling. Learn how to extract founders from delivery, build 'Delivery Lieutenants,' and unlock 12x valuation multiples.
50% Valuation Haircut for Founder Dependency
BRIEF · UNIT ECONOMICS
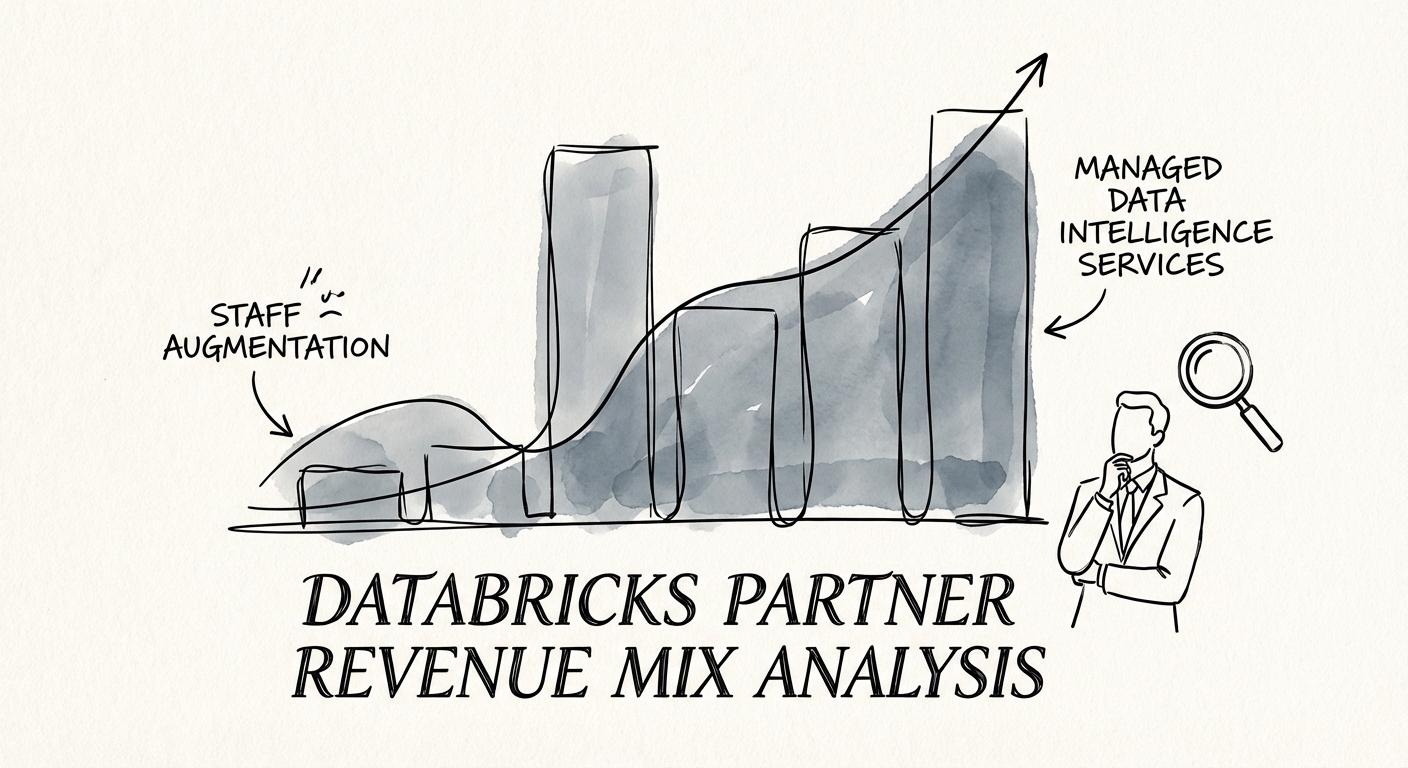
Your Databricks Practice Bills $30M. Why an Acquirer Only Pays for $9M of It.
Two Databricks partners, same $30M revenue. One sells at 6x EBITDA, the other at 14x. The difference is hiding in four line items on your P&L.
14x EBITDA Multiple for Data Intelligence Partners
BRIEF · FINANCIAL INFRASTRUCTURE
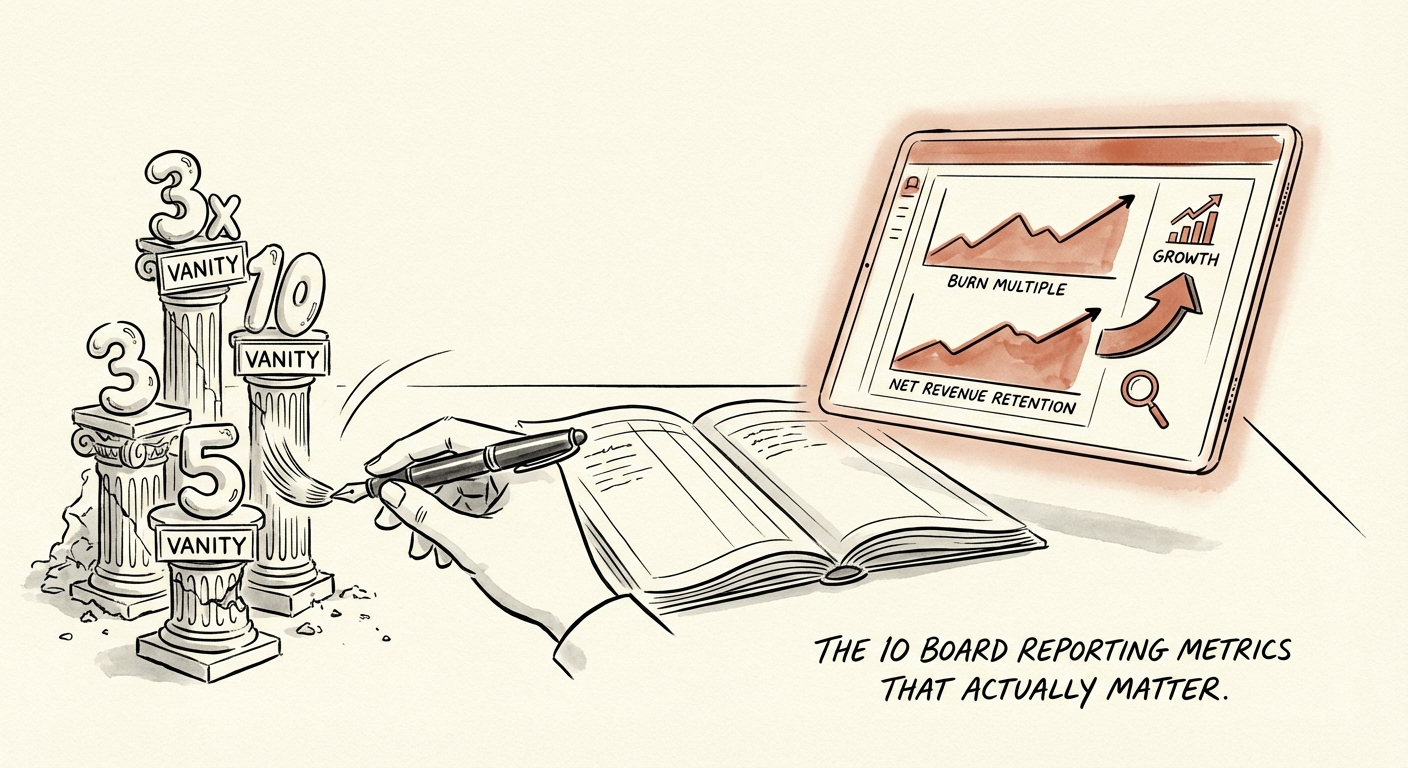
The 10 Board Reporting Metrics That Actually Matter (Stop the Vanity Show)
Stop presenting vanity metrics. Here are the 10 board reporting metrics that actually matter for Series B/C SaaS in 2026, including Burn Multiple and NRR benchmarks.
1.5x Max Burn Multiple
BRIEF · TEAM & HIRING
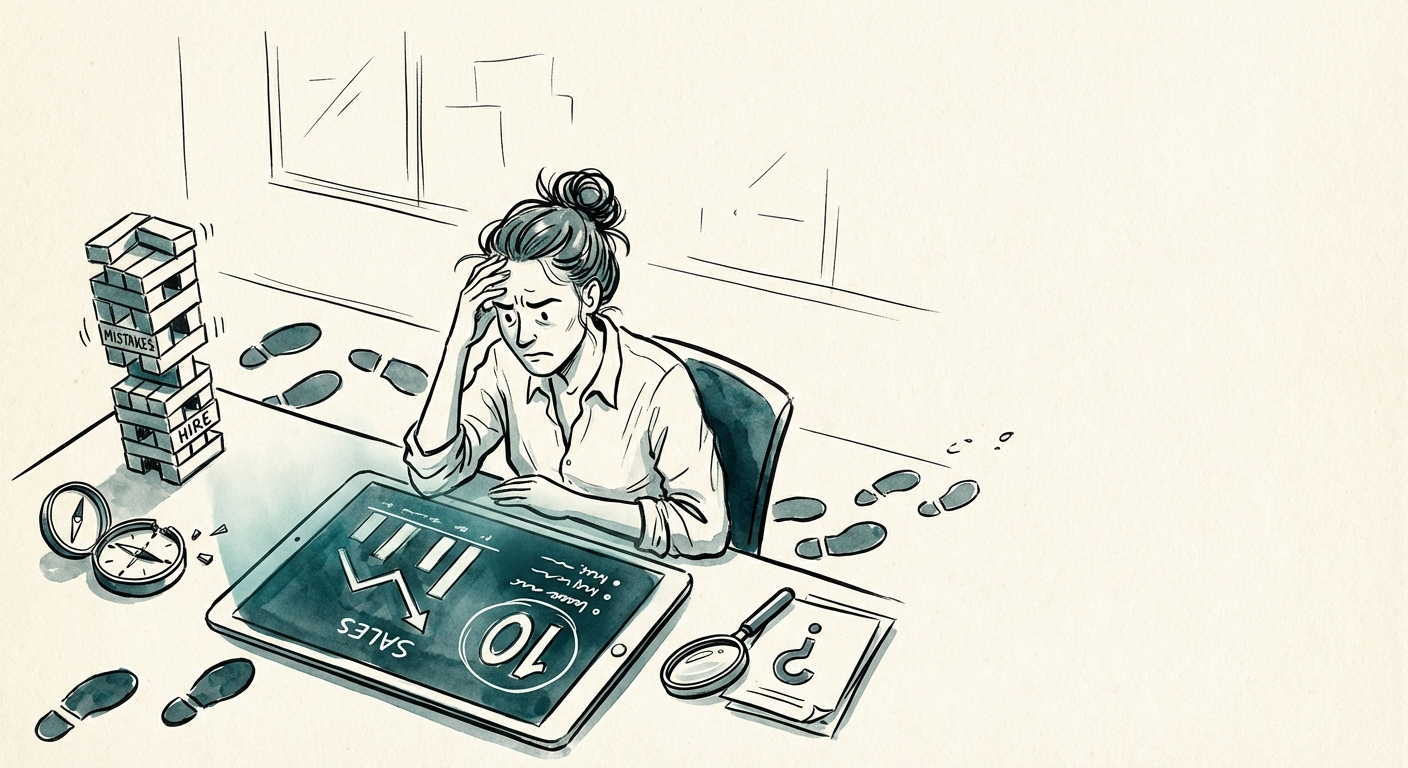
Your First VP of Sales Will Probably Fail. Here's the Series B Hiring Math That Changes the Odds.
Seven in ten first VP of Sales hires don't reach month 12. The 10 specific things Series B founders get wrong — and the readiness audit that fixes them.
70% Failure Rate of First VP Sales Hires
BRIEF · PROJECT RECOVERY
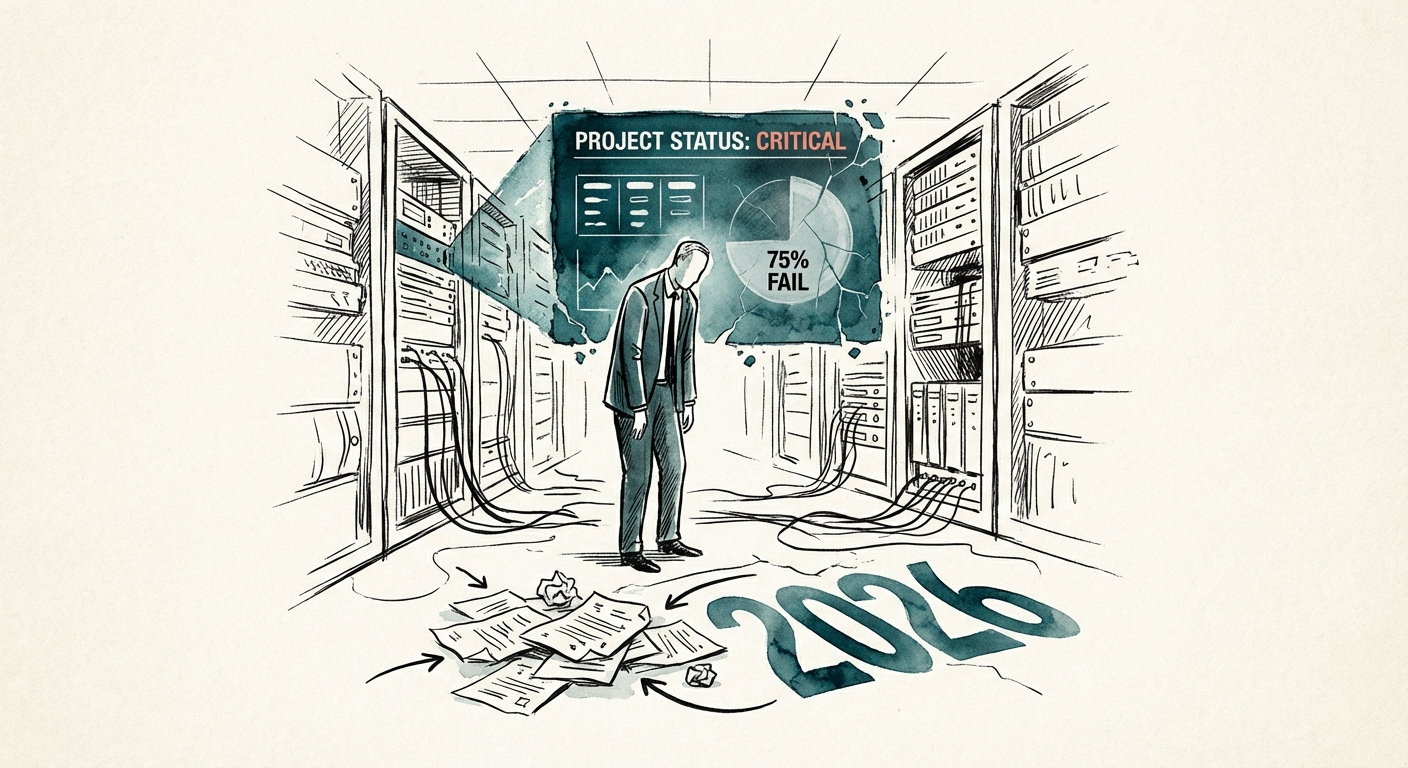
Why 70% of ERP Implementations Fail: The 2026 Autopsy
Gartner predicts 70% of ERP projects will fail by 2027. Here are the 10 root causes of failure and the operational playbook to fix them.
64% Projects with Budget Overruns
BRIEF · FINANCIAL INFRASTRUCTURE
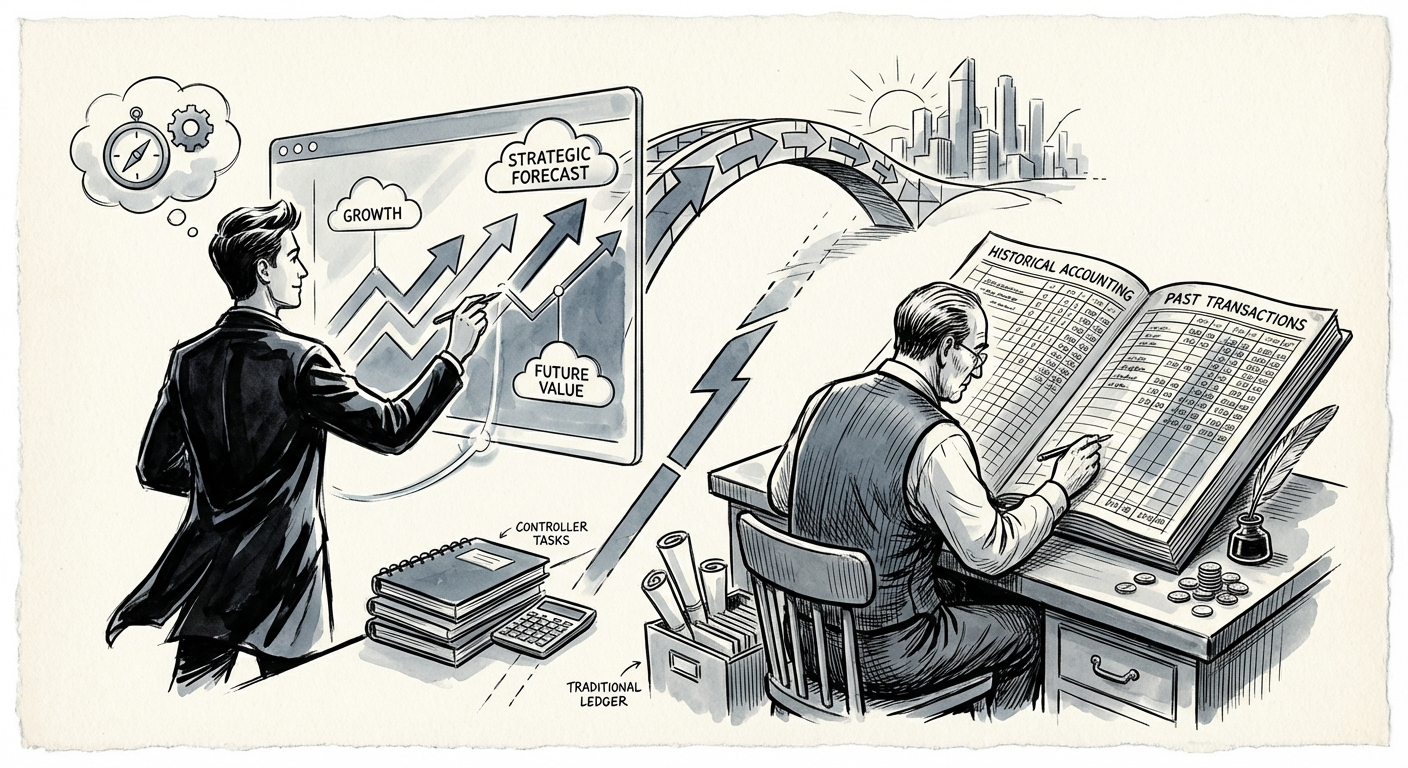
10 Signs You Need a Fractional CFO Instead of a Controller
Are you confusing accounting with finance? If your forecast accuracy is under 70% or your board deck is a panic drill, you need a Fractional CFO. Here is the diagnostic list.
82% Business Failures Due to Cash Mismanagement
BRIEF · EXIT READINESS
The 100-Day Plan That Actually Moves EBITDA (Not a Slide Deck)
Multiples compressed 27x to 18x. Holds stretched to 6.7 years. A 100-day plan built for operators who have to manufacture the markup, sprint by sprint.
18x vs 27x Multiple Compression (2021-2024)
BRIEF · TECHNICAL DEBT
120 Days to Unfreeze a Logistics Platform: A Technical Debt Paydown, Not a Rewrite
A PE-backed logistics SaaS stalled 90 days post-close. Here's the 120-day paydown that reclaimed 33% engineering capacity and shipped the roadmap, no rewrite.
33% Capacity Reclaimed
BRIEF · EXIT READINESS
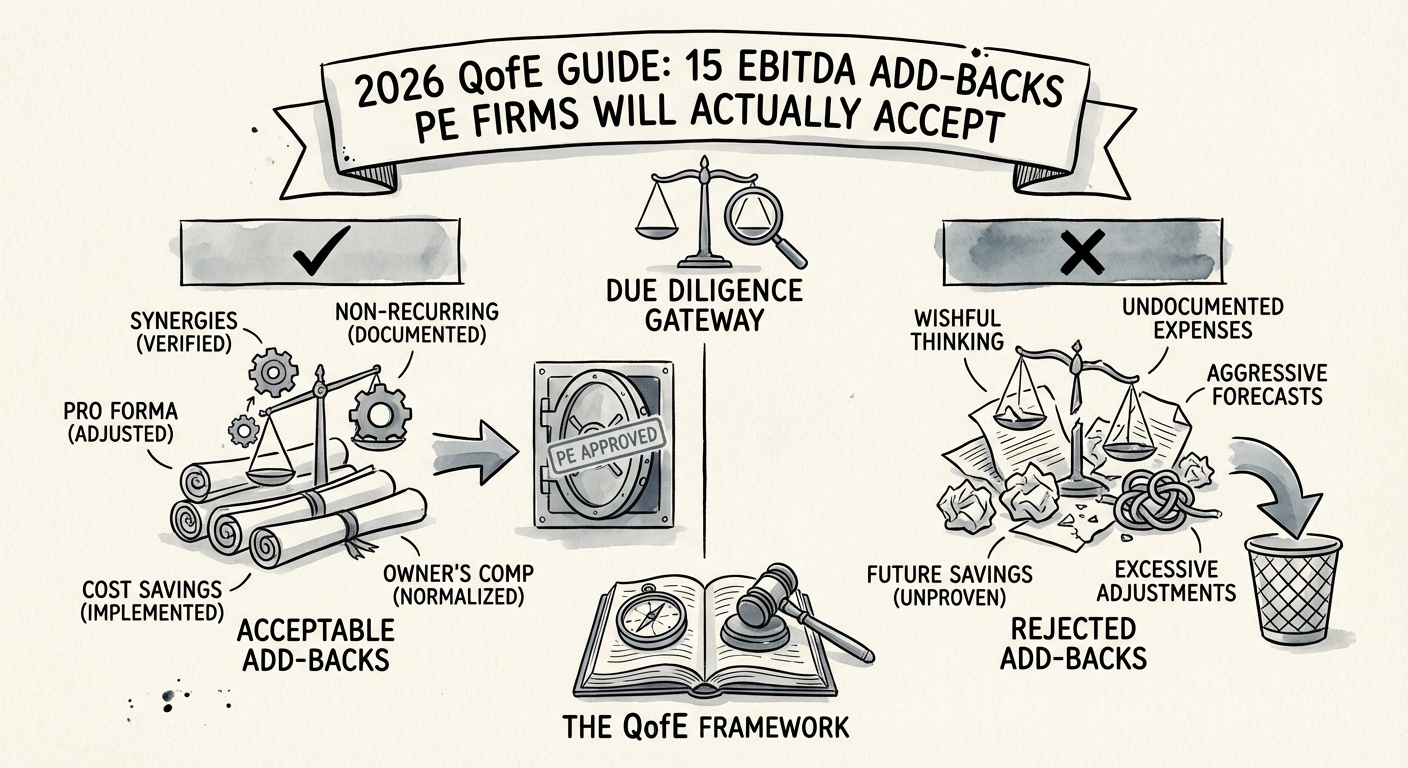
15 EBITDA Add-Backs PE Firms Will Actually Accept (The 2026 QofE Guide)
Stop guessing which add-backs survive diligence. Here are the 15 EBITDA adjustments PE firms actually accept in 2026, backed by S&P Global data.
29.4% Avg. Add-Back % (S&P Global)
BRIEF · PROJECT RECOVERY
How a Daily 15-Minute Standup Restarted a Frozen $10M Aerospace Program
A Fortune 1000 aerospace transformation sat "Green" for two quarters while shipping nothing. The fix wasn't more PMs. It was killing the weekly SteerCo.
92% Reduction in Decision Latency
BRIEF · TECHNICAL DEBT
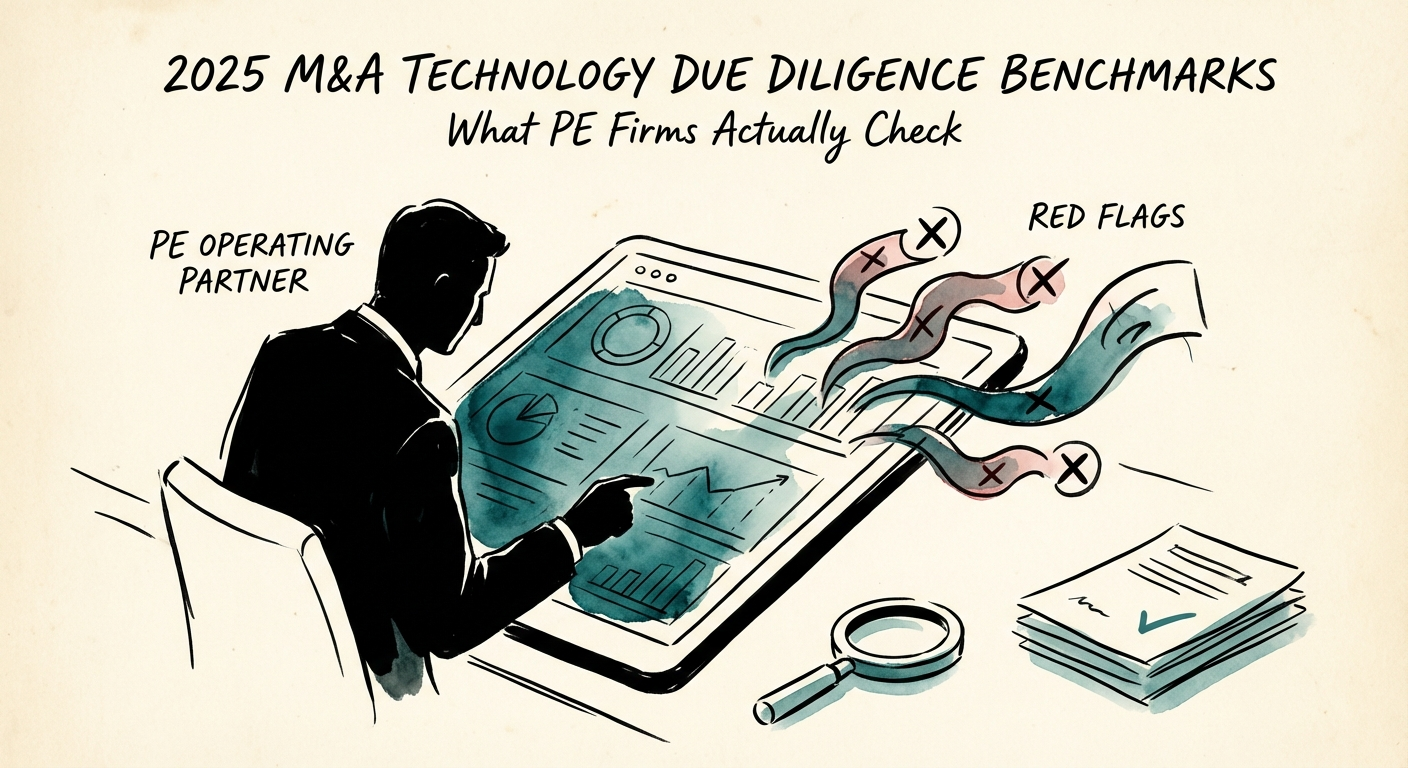
2025 M&A Technology Due Diligence Benchmarks: What PE Firms Actually Check
New 2025 data reveals 74% of target codebases contain high-risk vulnerabilities. See the actual benchmarks PE firms use to price technical debt.
74% Codebases with High-Risk Vulnerabilities
BRIEF · EXIT READINESS
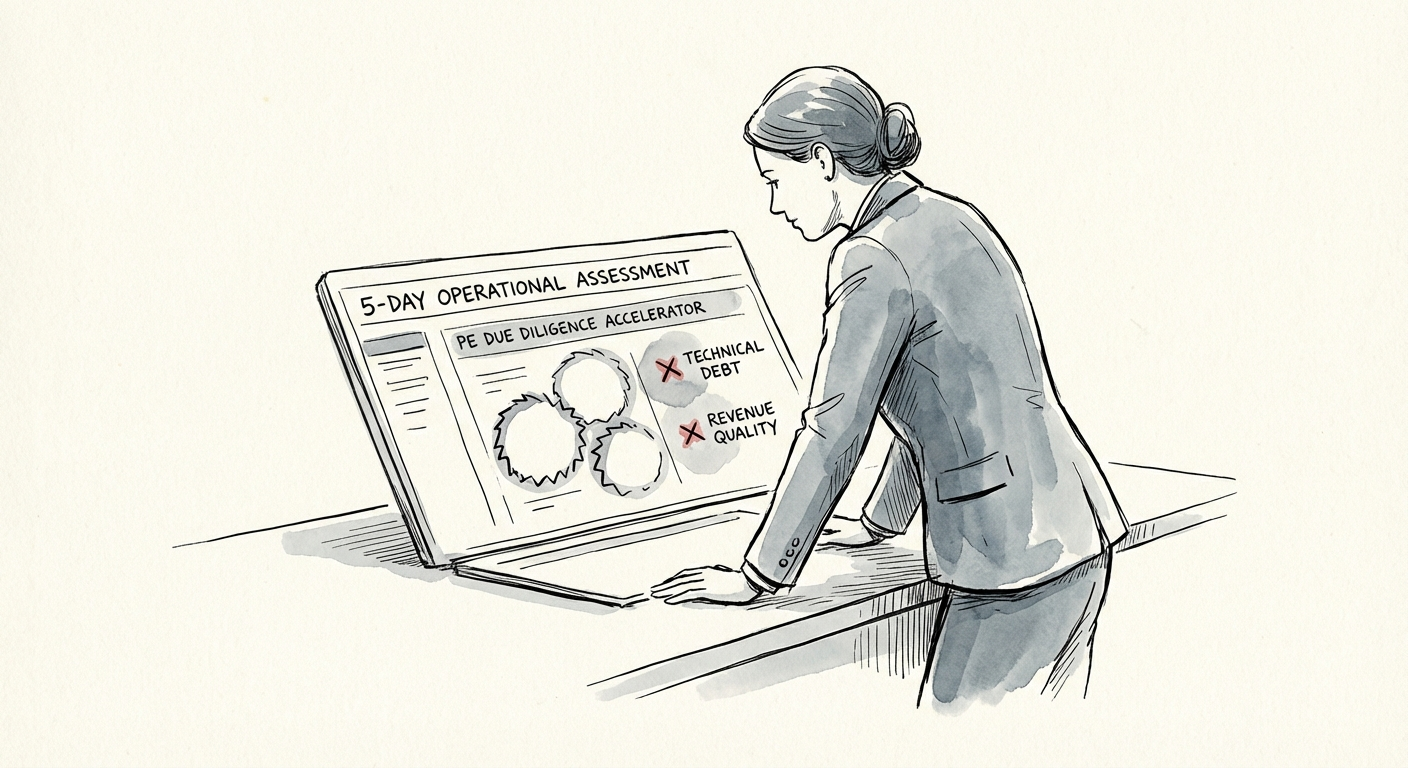
The 5-Day Operational Assessment: A PE Due Diligence Accelerator
Use a 5-day operational assessment to pressure-test EBITDA quality, technical debt, team dependencies, and scalability before signing.
5 days Operating diligence window
BRIEF · FOUNDER EXTRACTION
Founder-Led Sales Stalls at $10M: 7 Signs You're the Bottleneck
Your SaaS hit $10M because you closed every deal. Here are the 7 measurable signs that the same instinct is now capping growth — and the diagnostic to prove it.
5.7 Months Avg. Sales Rep Ramp Time (2025)
BRIEF · TECHNICAL DEBT
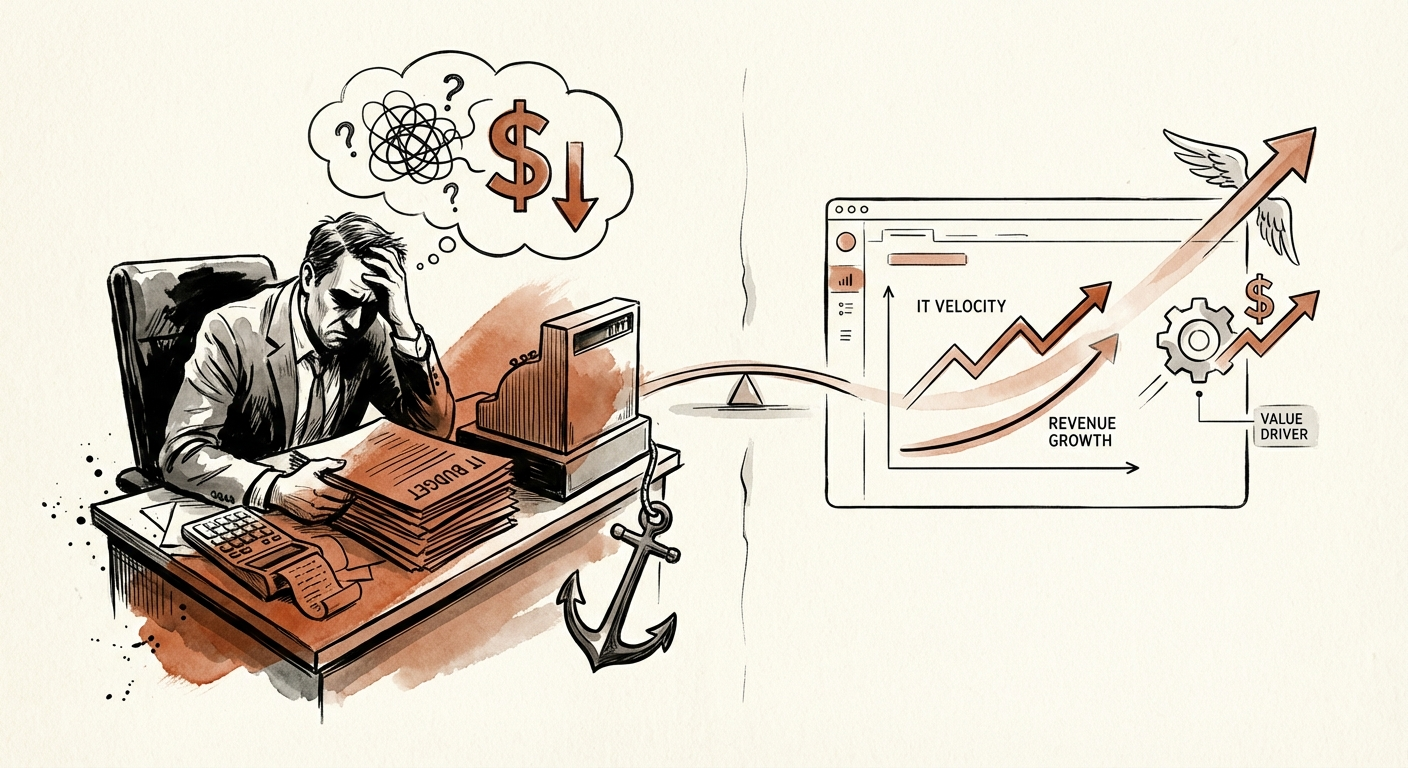
7 Signs Your IT Organization Is a Cost Center (Not a Value Driver)
Is your IT department reducing EBITDA? Check these 7 diagnostic signs backed by 2025 Gartner and McKinsey benchmarks. Learn how to pivot from cost center to value driver.
4-5x Faster Revenue Growth (Top Quartile DVI)
BRIEF · EXIT READINESS
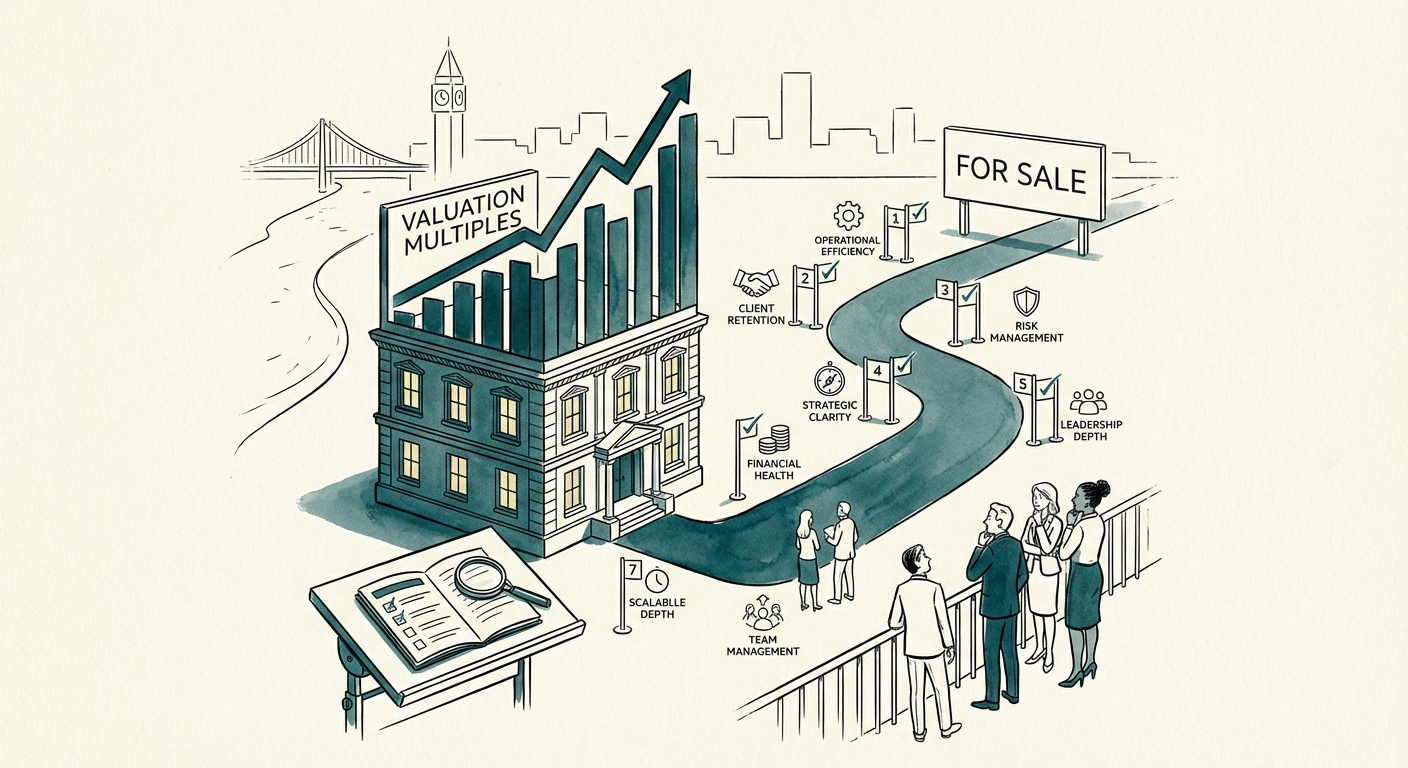
7 Signs Your Professional Services Firm Is Ready to Sell (Not Just Listed)
Project shops clear ~1.3x revenue; firms with recurring revenue and no founder dependency hit 2.5x. Seven checks that separate a real exit from a fire sale.
35% Valuation Discount for High Concentration
BRIEF · PROJECT RECOVERY
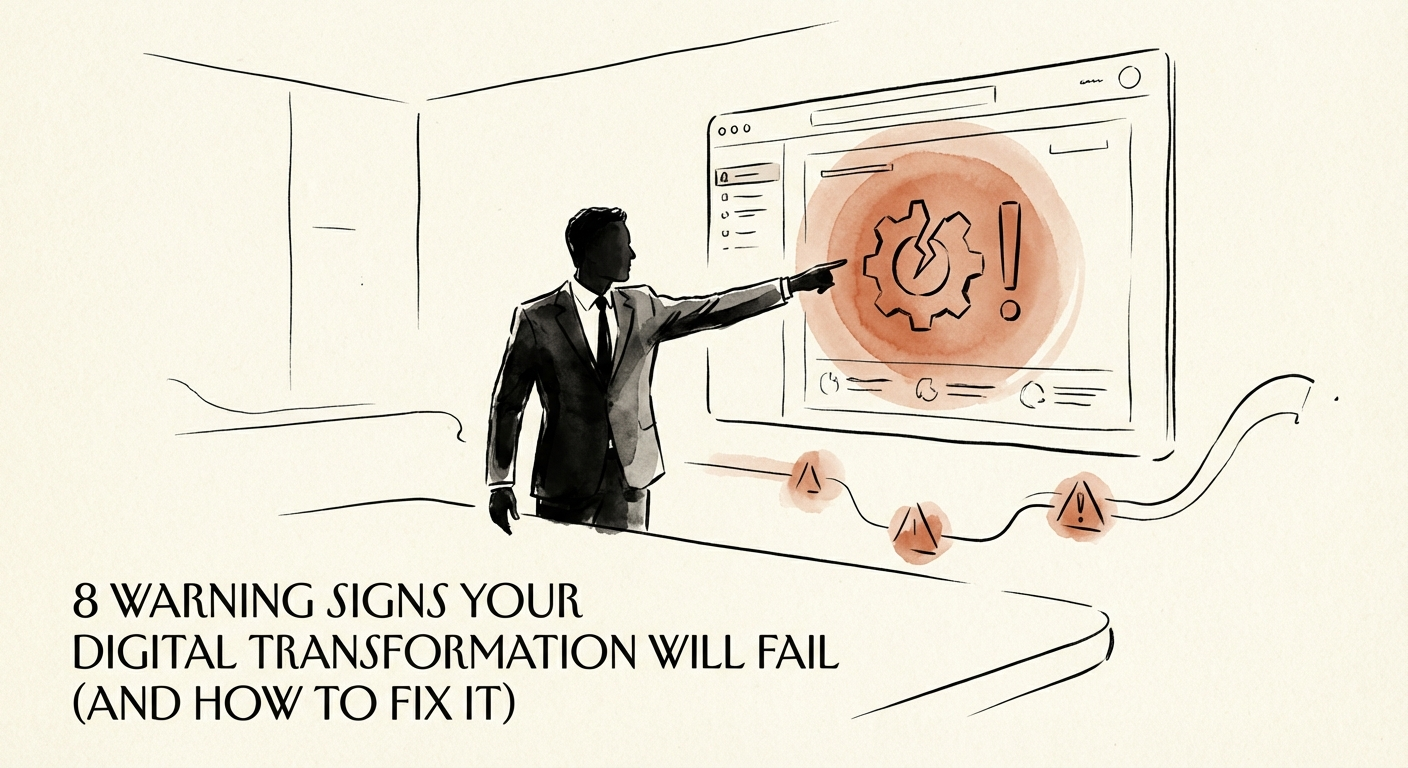
8 Warning Signs Your Digital Transformation Will Fail (And How to Fix It)
New 2025 data shows 88% of transformations miss their targets. Learn the 8 early warning signs of failure and the governance fixes to save your initiative.
88% Failure Rate (Bain 2024)
BRIEF · EXIT READINESS
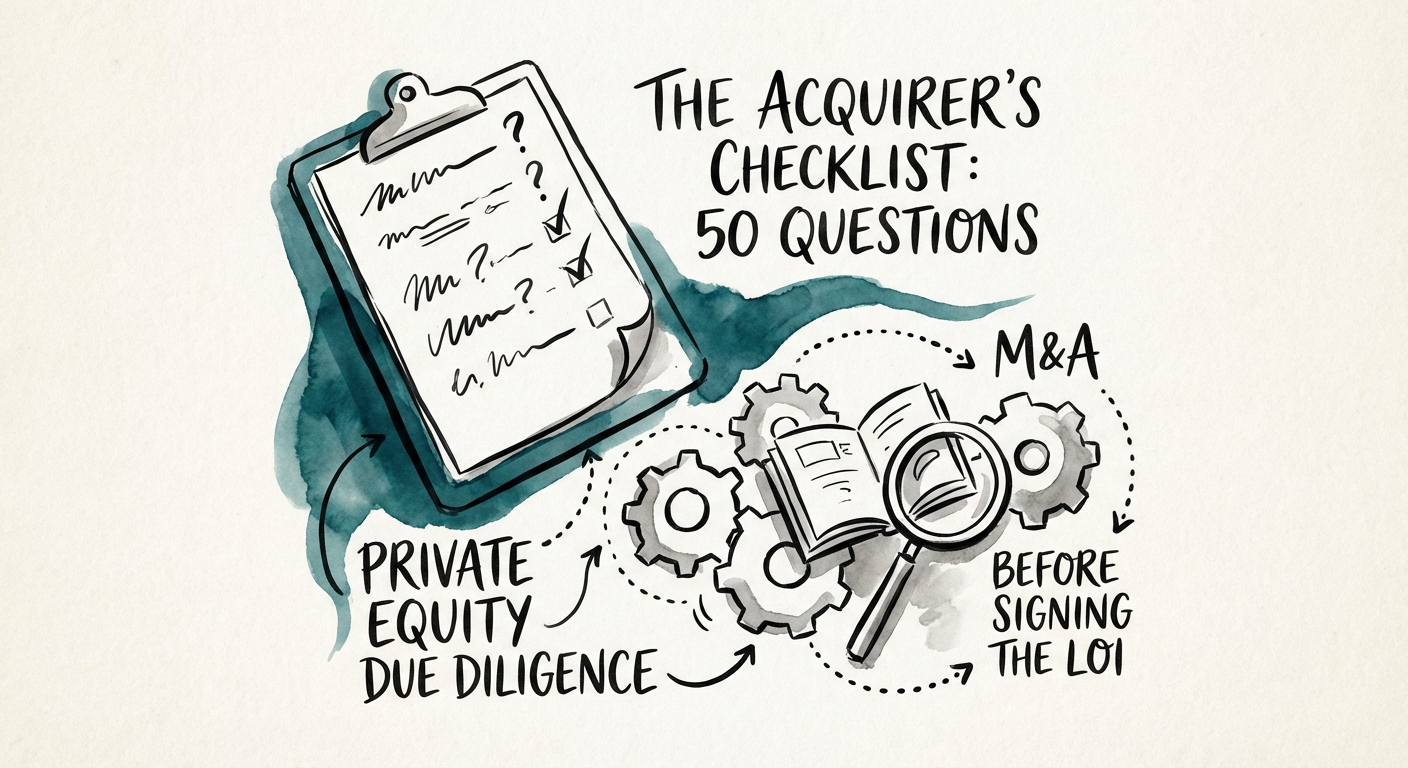
The Acquirer’s Checklist: 50 Questions to Ask Before Signing the LOI
Don't sign the LOI until you ask these 50 questions. 70% of deals fail in diligence—use this diagnostic to spot revenue leakage, technical debt, and key-person risk early.
70% Deal Failure Rate in Diligence
BRIEF · PROJECT RECOVERY
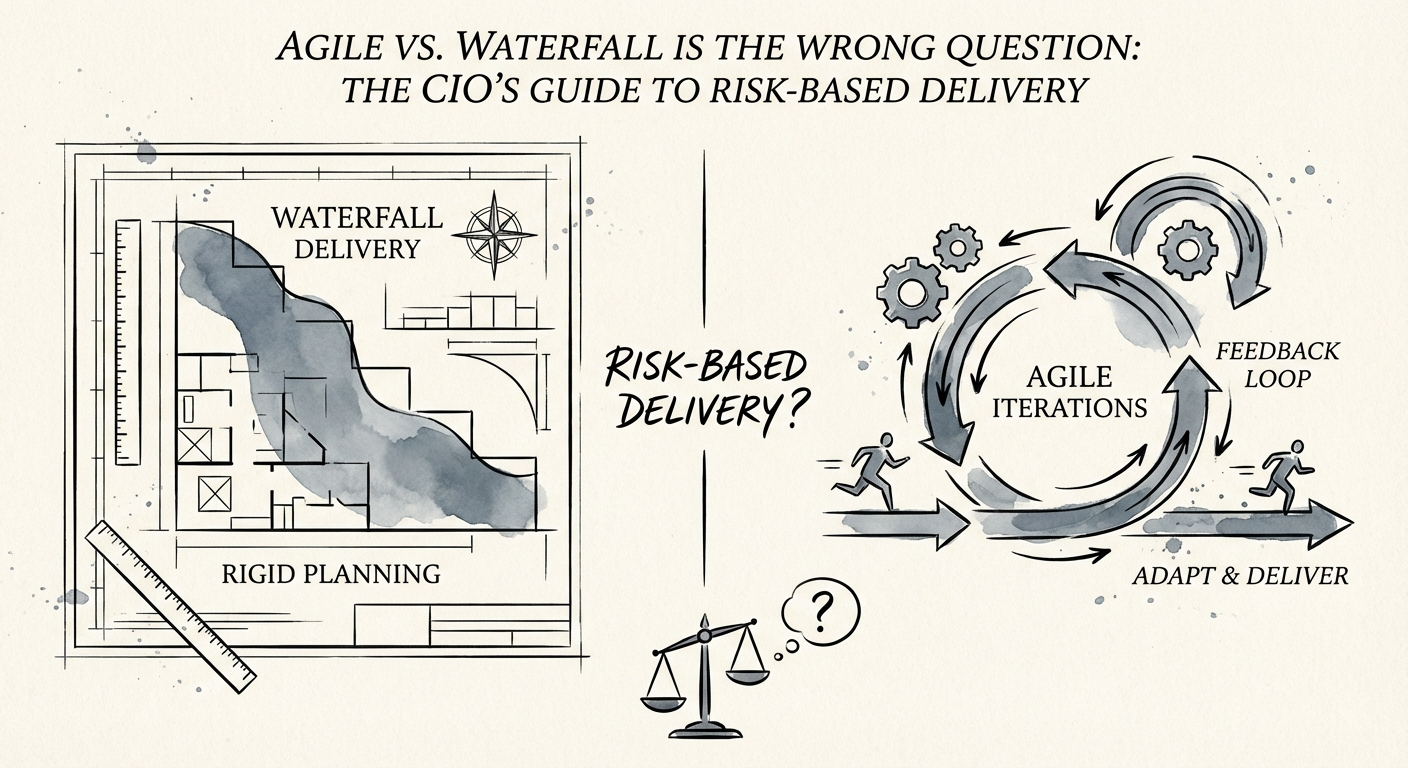
Agile vs. Waterfall is the Wrong Question: The CIO’s Guide to Risk-Based Delivery
New data reveals unstructured Agile projects are 268% more likely to fail. Here is the risk-based framework for choosing the right methodology for enterprise implementations.
268% Higher Failure Rate (Unstructured Agile)
BRIEF · EXIT READINESS
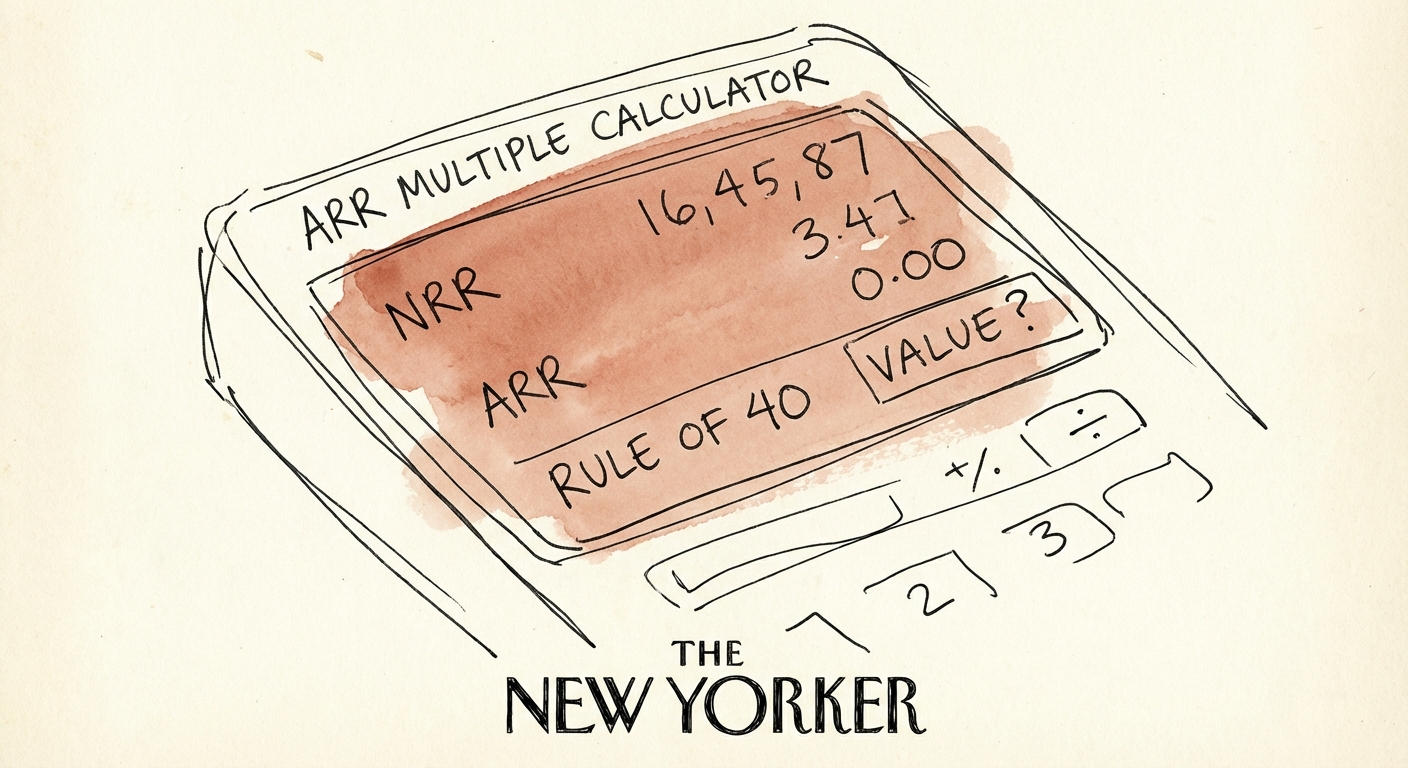
The ARR Multiple Calculator: Why Your "10x" Is Probably a 4x
A $15M ARR SaaS founder thinks they're worth $120M. The buyer's math says $45M. Here's the actual calculator PE firms run on your retention, efficiency, and growth.
63% Valuation Premium for >120% NRR
BRIEF · TEAM & HIRING
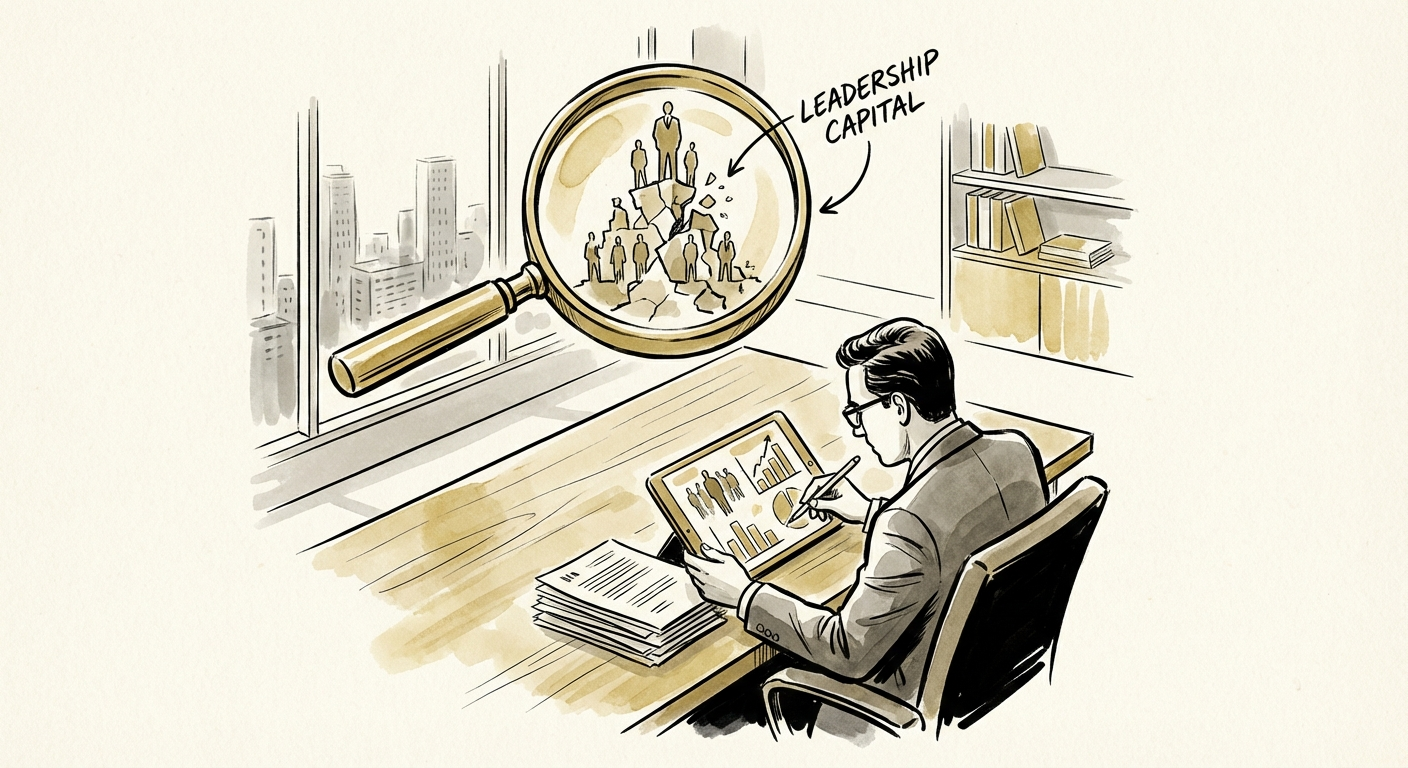
Two Dinners and a Gut Check: How to Actually Diligence a Management Team
73% of portfolio CEOs get replaced during the hold. Here is the 5-day capability audit that runs alongside your QoE and tells you who scales before you sign.
73% Portfolio CEO Turnover Rate
BRIEF · EXIT READINESS
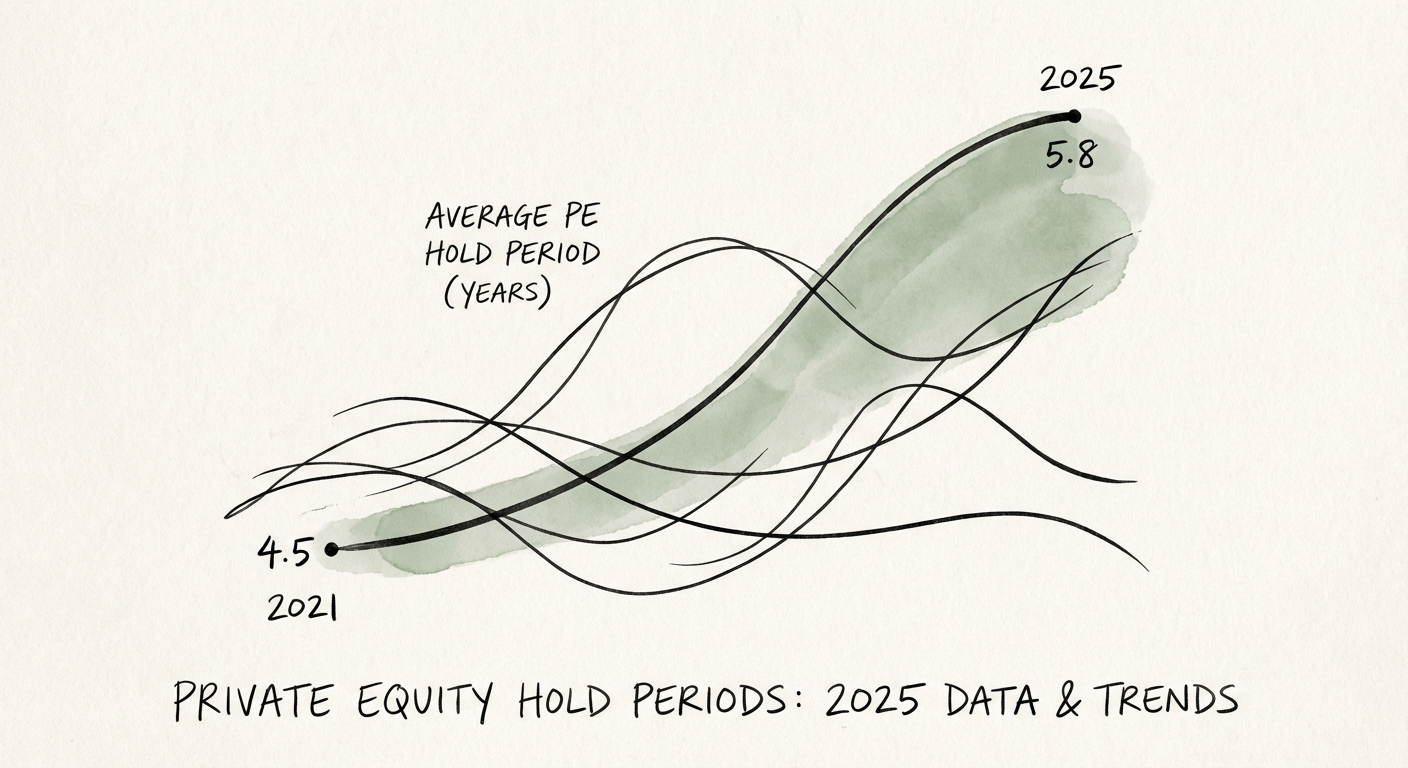
Average PE Hold Period by Industry: 2025 Data and Trends
2025 data shows the median PE hold period has settled at 5.8 years. Analysis of exit trends in healthcare vs. software, continuation fund surges, and the new operator playbook.
5.8 Years Median Hold Period (2025 Exits)
BRIEF · UNIT ECONOMICS
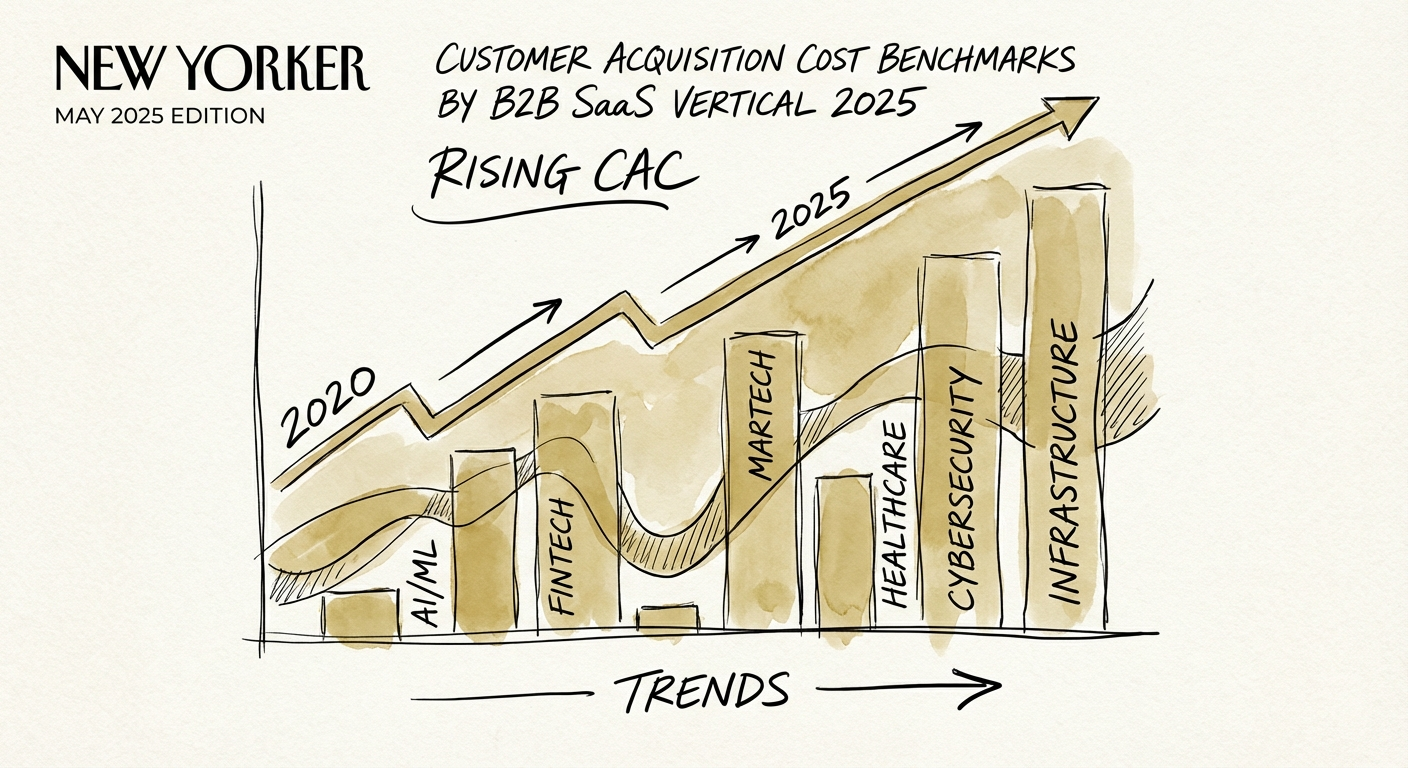
Why Your FinTech CAC Is $14,774 and Your Competitor's Is $1,461
FinTech enterprise CAC hit $14,774 in 2025 — 10x its SMB number. The vertical and channel benchmarks that explain why your acquisition costs jumped, and what to do.
60% Increase in CAC Since 2020