BRIEF · EXIT READINESS
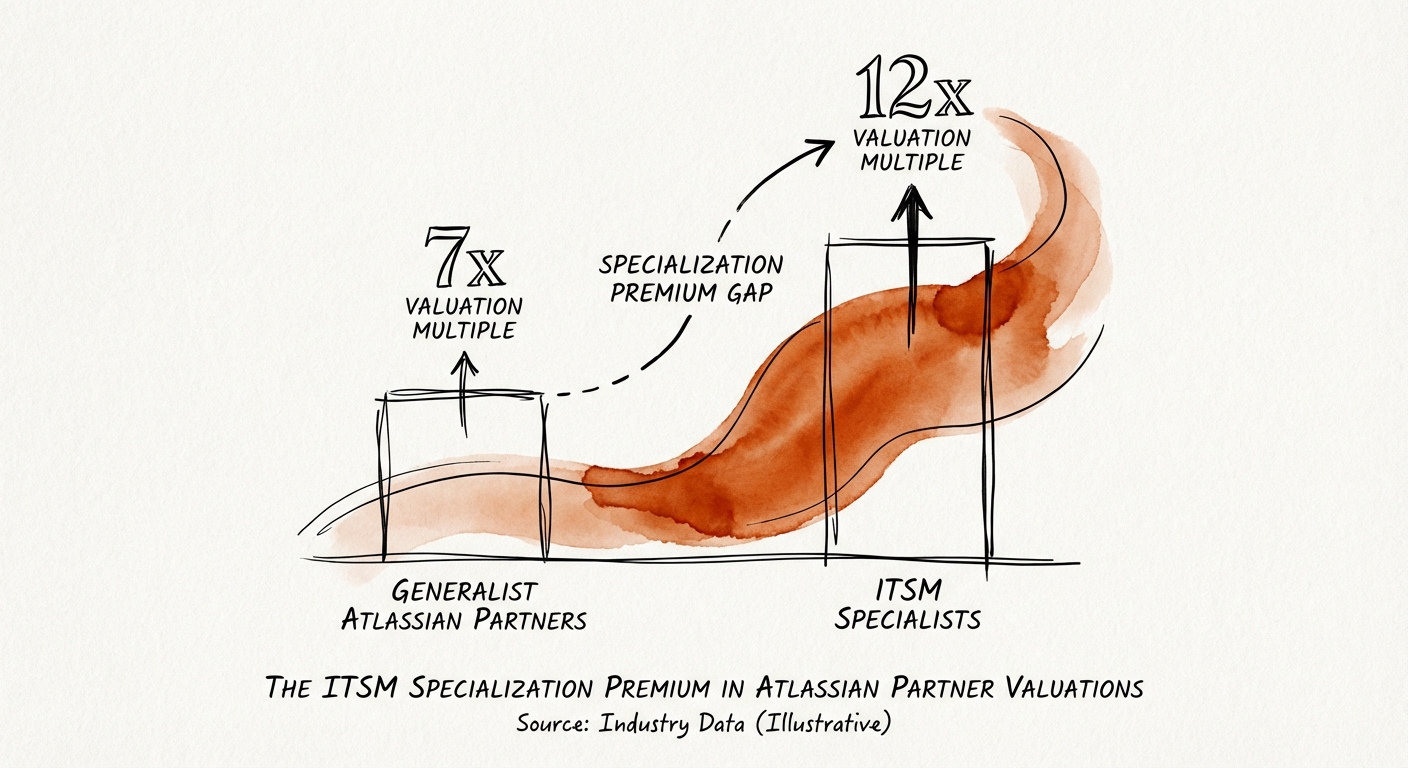
The ITSM Specialization Premium: Why JSM Partners Trade at 12x While Jira Generalists Stall at 7x
Why Atlassian partners with Jira Service Management (JSM) specialization trade at 12x EBITDA while generalists stall at 7x. A guide for PE sponsors.
4-5x Valuation Turn Premium
BRIEF · REVENUE ARCHITECTURE
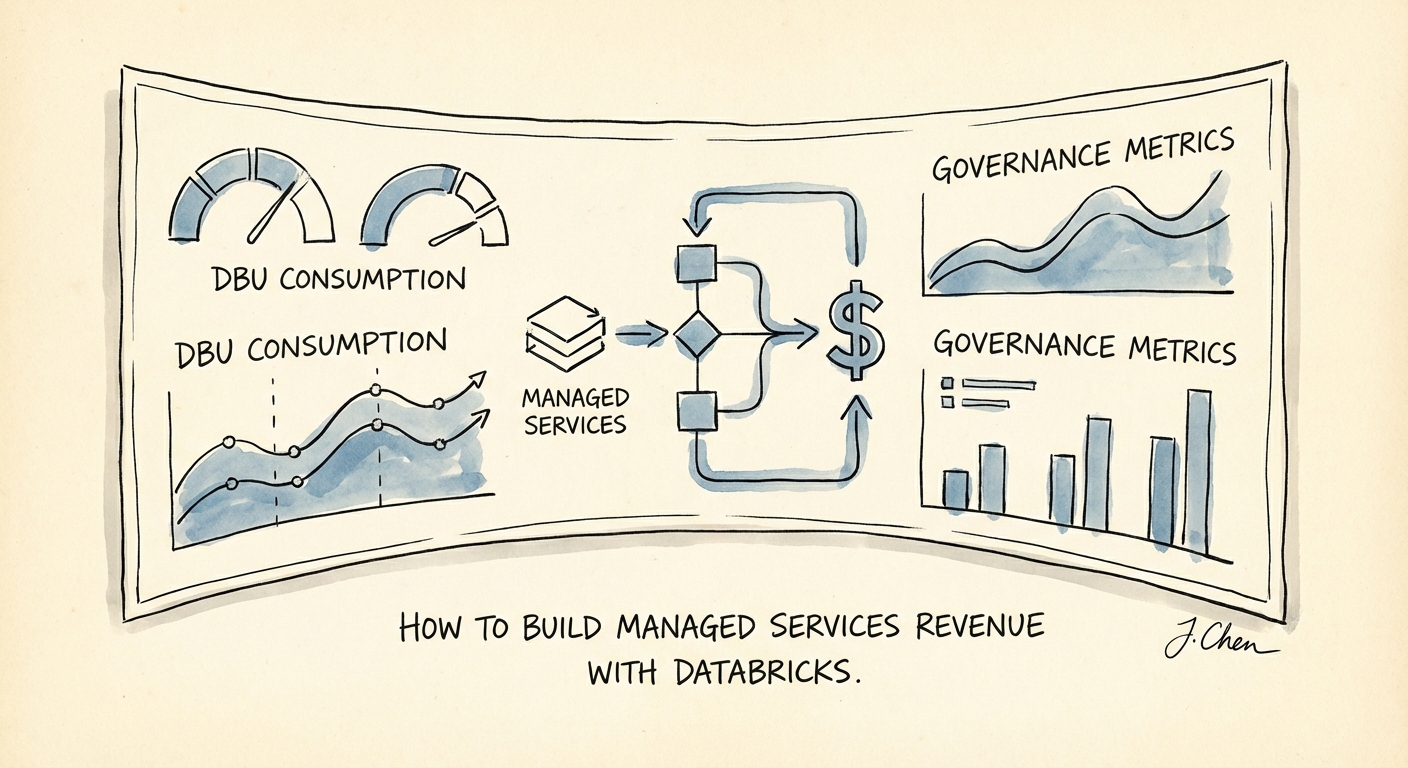
The Databricks DBU You Sold But Never Managed: Turning Consumption Into Recurring Revenue
Your client bought a 3-year DBU commit and can't burn it. That's your recurring-revenue opening. How Databricks partners build a managed practice worth a premium multiple.
15.2x Top-Tier EBITDA Multiple
BRIEF · UNIT ECONOMICS
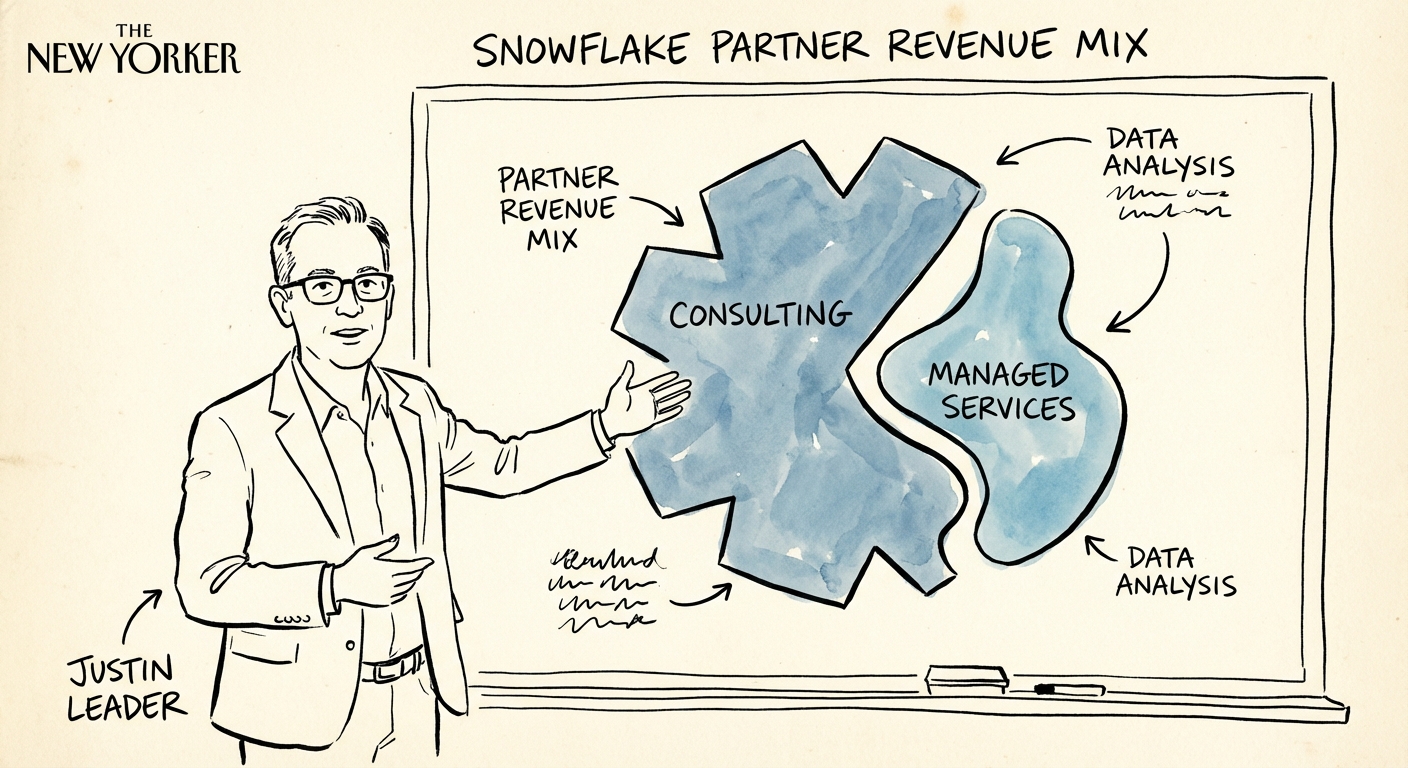
Two Snowflake Partners, Same Logo, Half the Valuation: What Your Revenue Mix Tells a Buyer
A $15M Snowflake partner with 40% managed services outvalues a $20M migration shop. Here is the revenue-mix math buyers run, and how to move your line.
12x vs 6x EBITDA Multiple Gap (Managed vs. Consulting)
BRIEF · UNIT ECONOMICS
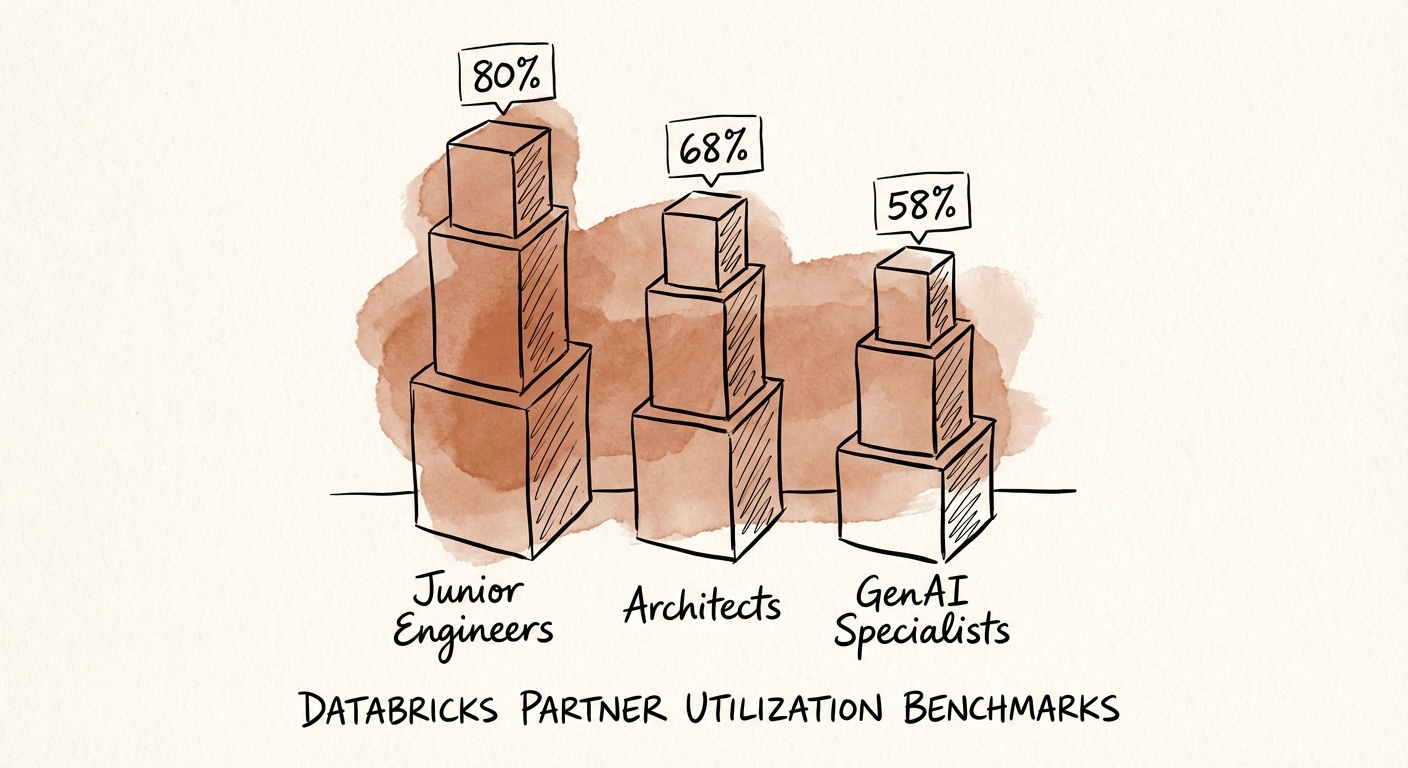
Databricks Partner Utilization Benchmarks: Why 85% Is a Trap (And 72% Is the Goal)
Why very high utilization can weaken Databricks partner valuations. 2026 benchmarks for Data Engineers vs. Architects, and the strategy that preserves time for IP.
72% Optimal Billable Utilization
BRIEF · FOUNDER EXTRACTION
The $10M Snowflake Ceiling: Scaling Beyond Founder 'Heroics'
Why Snowflake partners stall at $10M ARR. A diagnostic playbook for extracting founder 'heroics' and building a consumption-first operating model.
433% Rev. Growth (Mature vs. Hero)
BRIEF · UNIT ECONOMICS
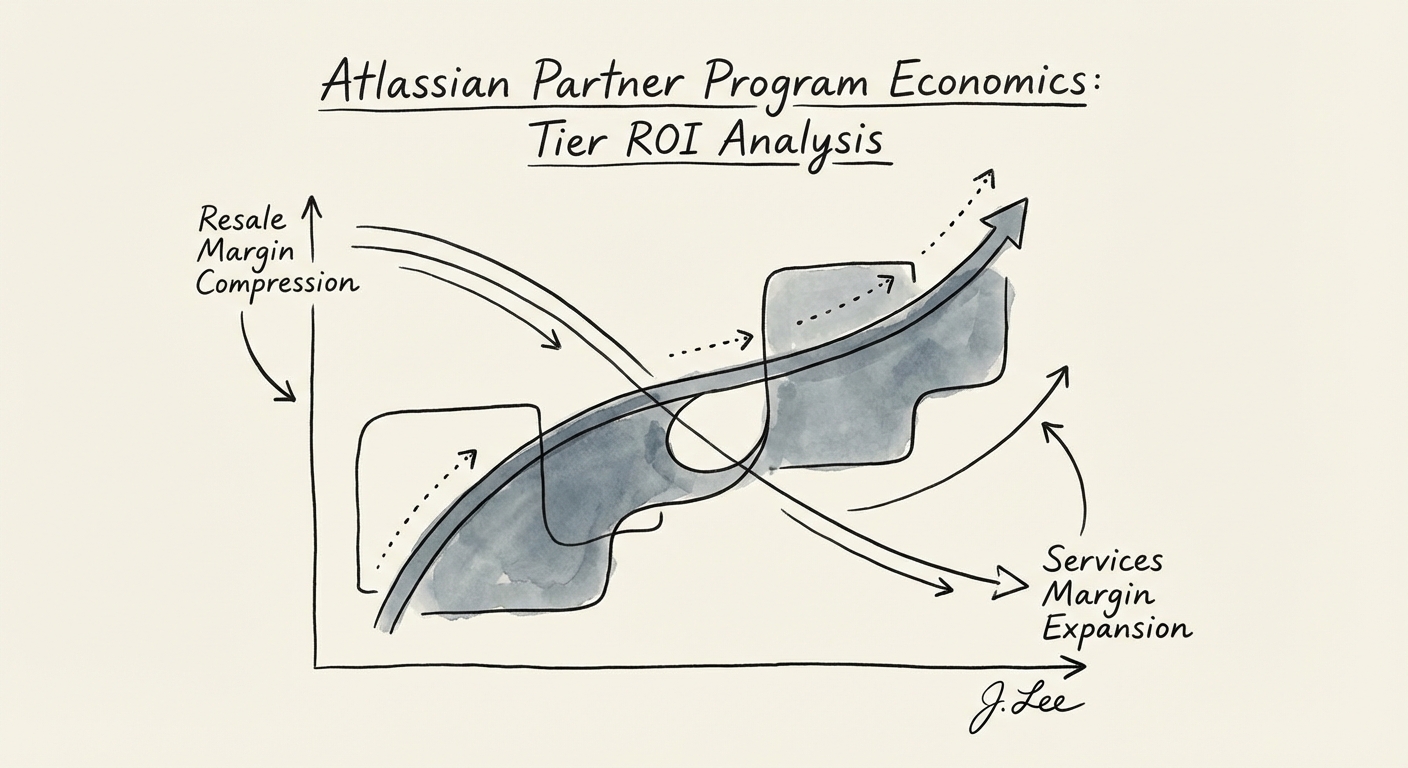
The Atlassian Partner Economics: Why 'Platinum' Status Might Be Killing Your Margins
A diagnostic guide for Atlassian partners on program tier economics. Analyze Silver vs. Platinum ROI, resale margin compression, and the valuation impact of pivoting from license resale to specialized services.
18.2% Avg. Resale Margin Decline
BRIEF · EXIT READINESS
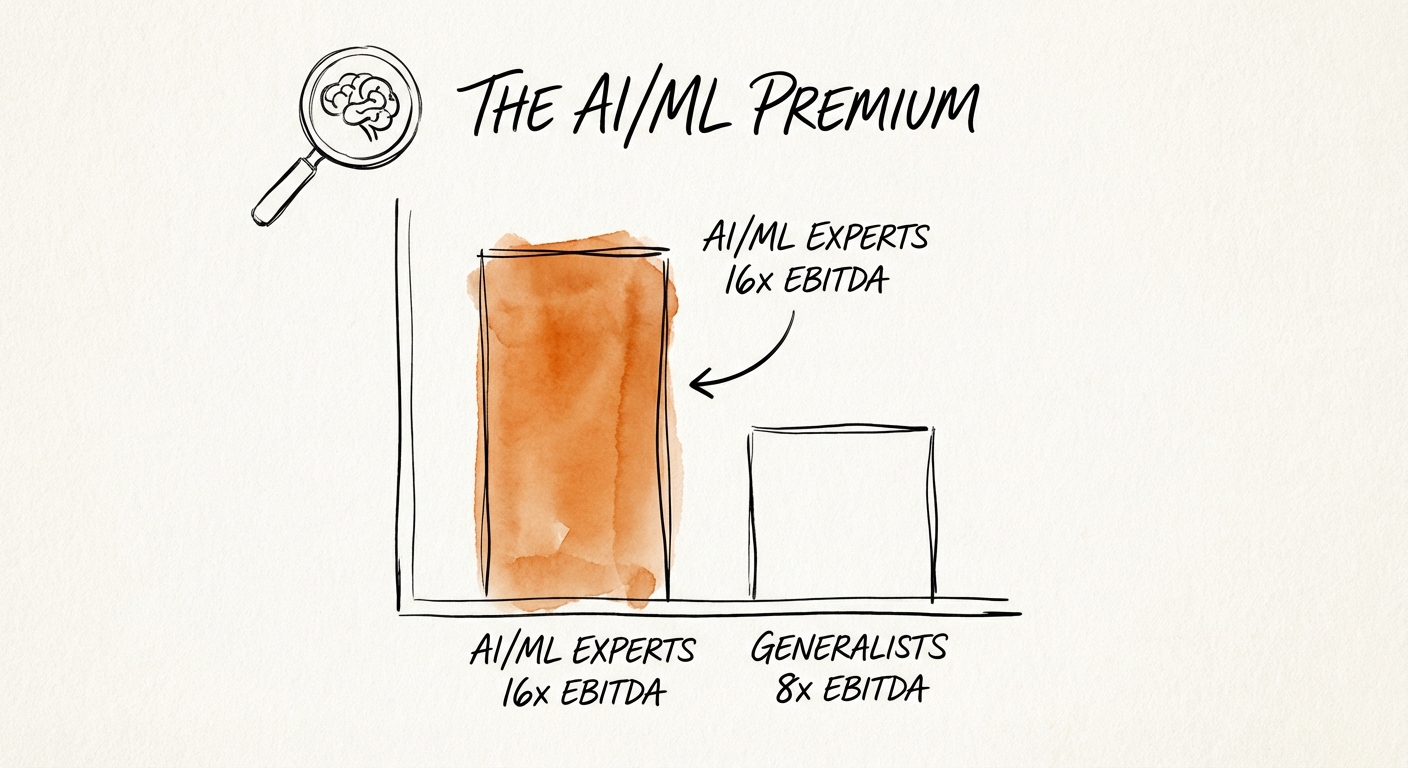
The AI/ML Expertise Premium: Why Snowflake Partners with 'Cortex' DNA Trade at 16x
Generalist Snowflake partners trade at 8x EBITDA while AI/ML specialists command 16x. Here is the valuation diagnostic for PE sponsors and founders.
16x EBITDA Multiple
BRIEF · REVENUE ARCHITECTURE
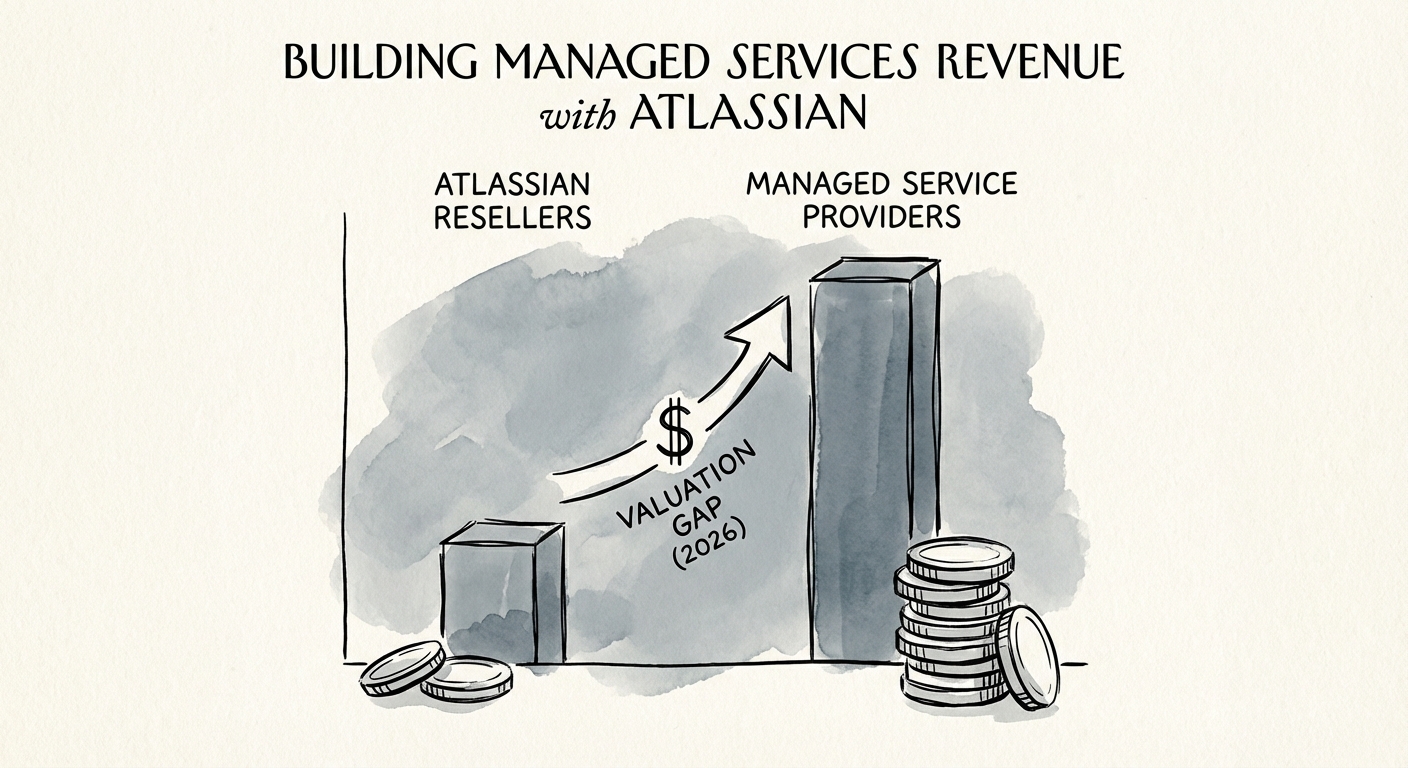
The Atlassian Partner's Margin Cliff: Turning License Resale Into Recurring MSP Revenue
Atlassian resale margins are gone and migrations are drying up. Here's how partners build recurring managed-services revenue around Cloud governance, JSM, and Confluence sprawl.
45% Target MSP Attach Rate
BRIEF · EXIT READINESS
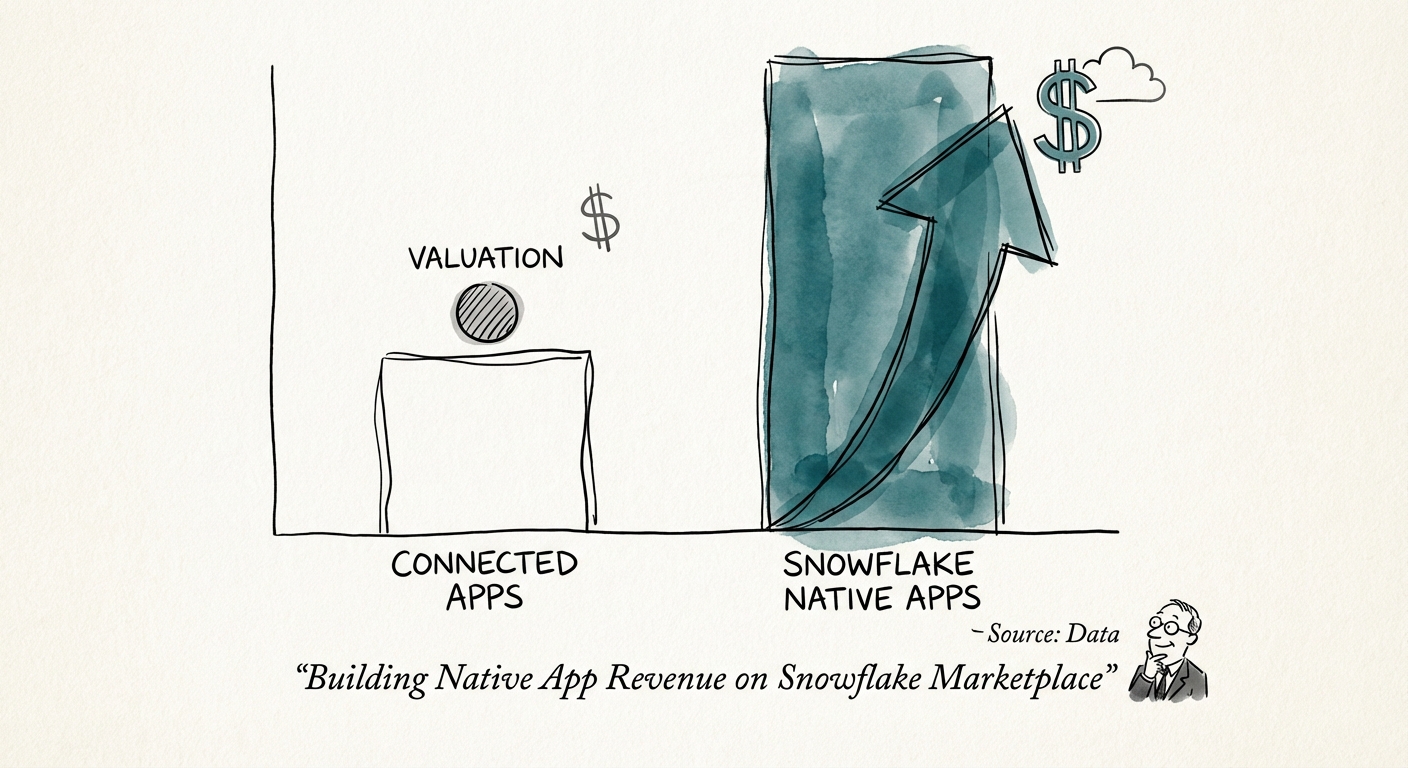
The Native App Premium: Why 'Data Gravity' Drives 14x Exit Multiples on Snowflake Marketplace
Why building Snowflake Native Apps drives higher exit multiples than connected SaaS. 2026 benchmarks for ISV valuation, monetization models, and NRR.
14x EBITDA Multiple for Top-Tier Native Apps
BRIEF · EXIT READINESS
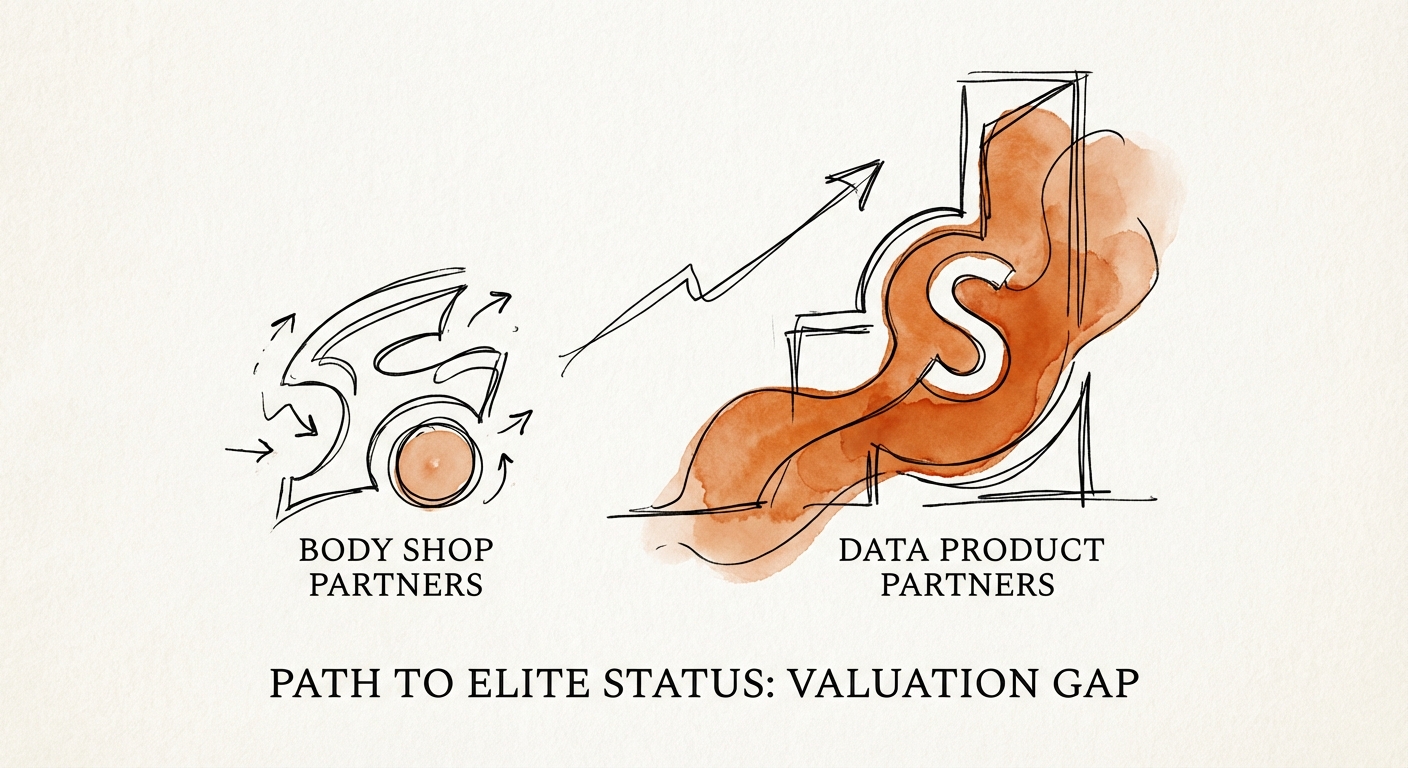
Snowflake Partner Growth Benchmarks: Path to Elite Status
Benchmarks for scaling Snowflake practices from Premier to Elite. Analysis of revenue thresholds, valuation multiples, and the 'consumption gap' that kills exits.
14x EBITDA Multiple for Elite Data Partners
BRIEF · UNIT ECONOMICS
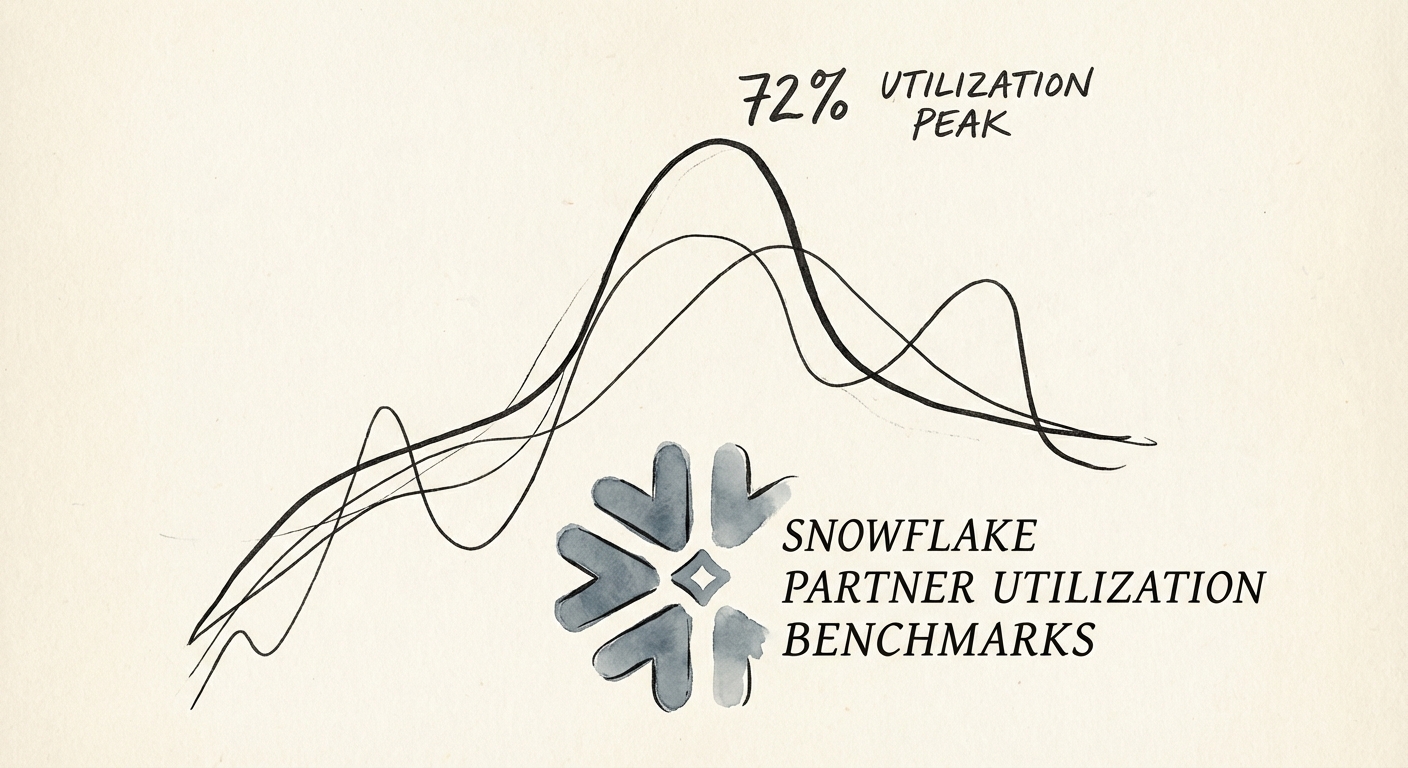
Snowflake Partner Utilization Benchmarks: Why 85% Is a Trap (And 72% Is the Goal)
Why 85% utilization kills Snowflake partner valuations. 2025 benchmarks for billable hours vs. consumption revenue (ACR) and the 72% operational sweet spot.
72.4% Optimal Billable Utilization
BRIEF · EXIT READINESS
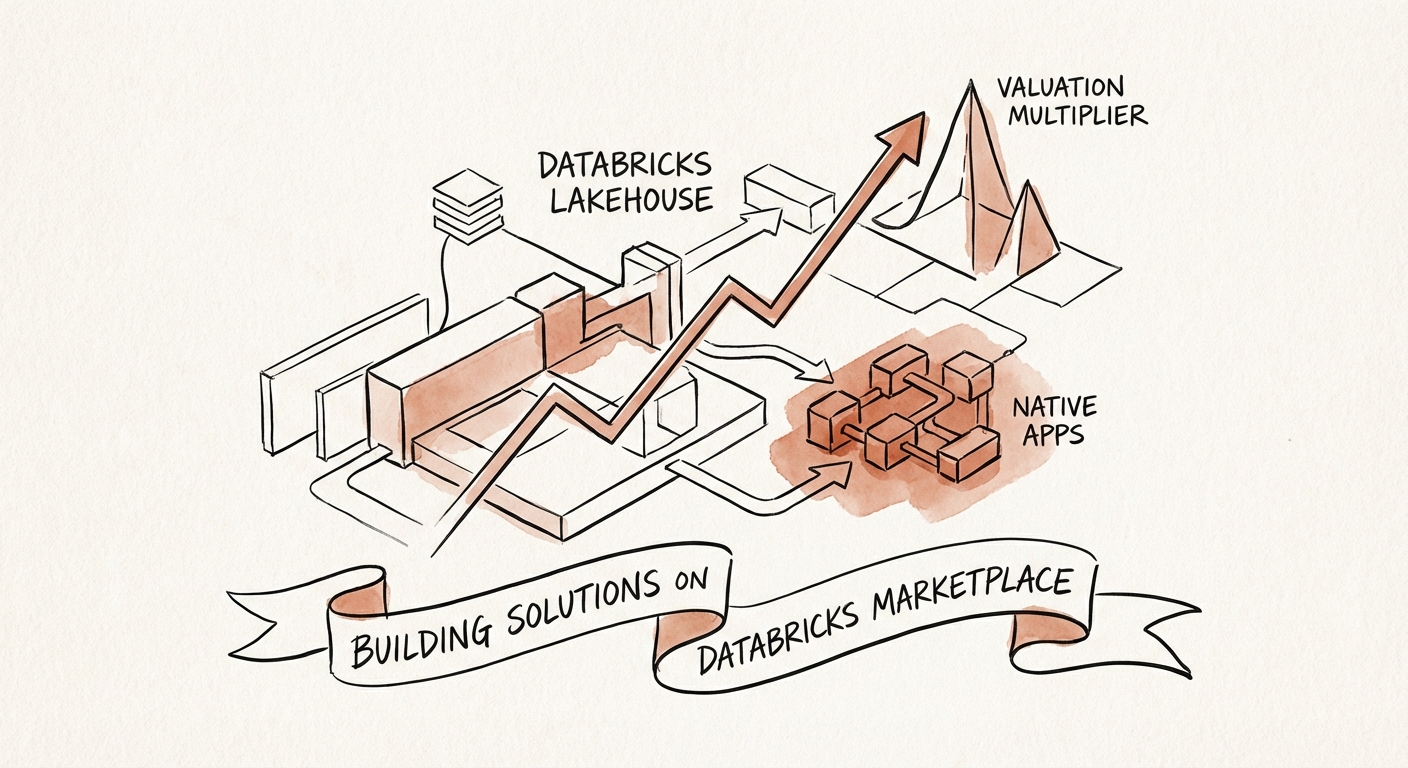
The 'Lakehouse' Multiplier: Why Your Next Exit Depends on Databricks Marketplace
Why building a Native App on Databricks Marketplace is the fastest path to a 12x exit. Analysis of valuation premiums, MACC burn-down, and the 'Data Intelligence' shift.
12x Revenue Valuation Multiple
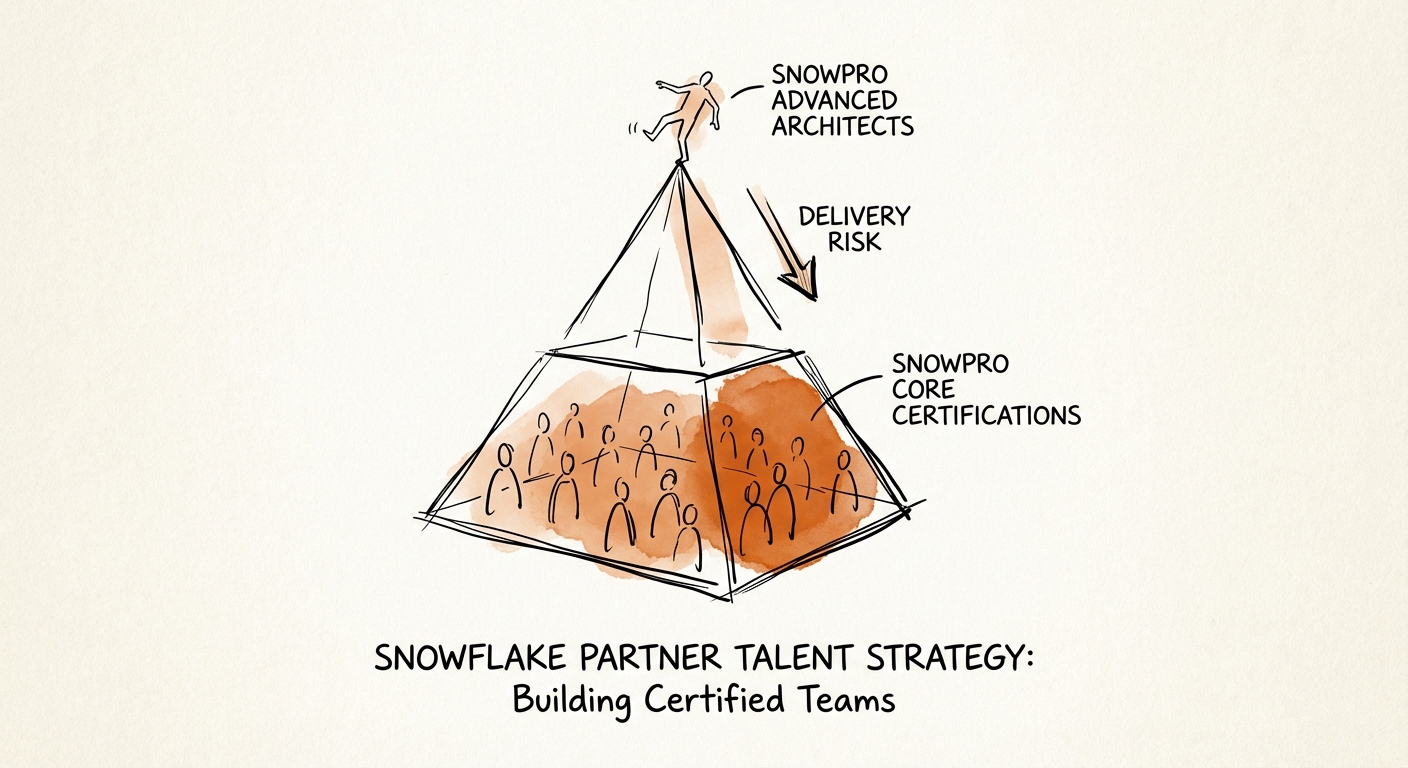
BRIEF · TEAM & HIRING
The Snowflake Talent Trap: Why 'Certified' Teams Are Bleeding Margins
Why "SnowPro Core" counts are a vanity metric. A diagnostic guide for PE sponsors on assessing Snowflake partner talent quality, attrition risks, and margin impacts in 2026.
$215,000 Replacement Cost: SnowPro Advanced Architect
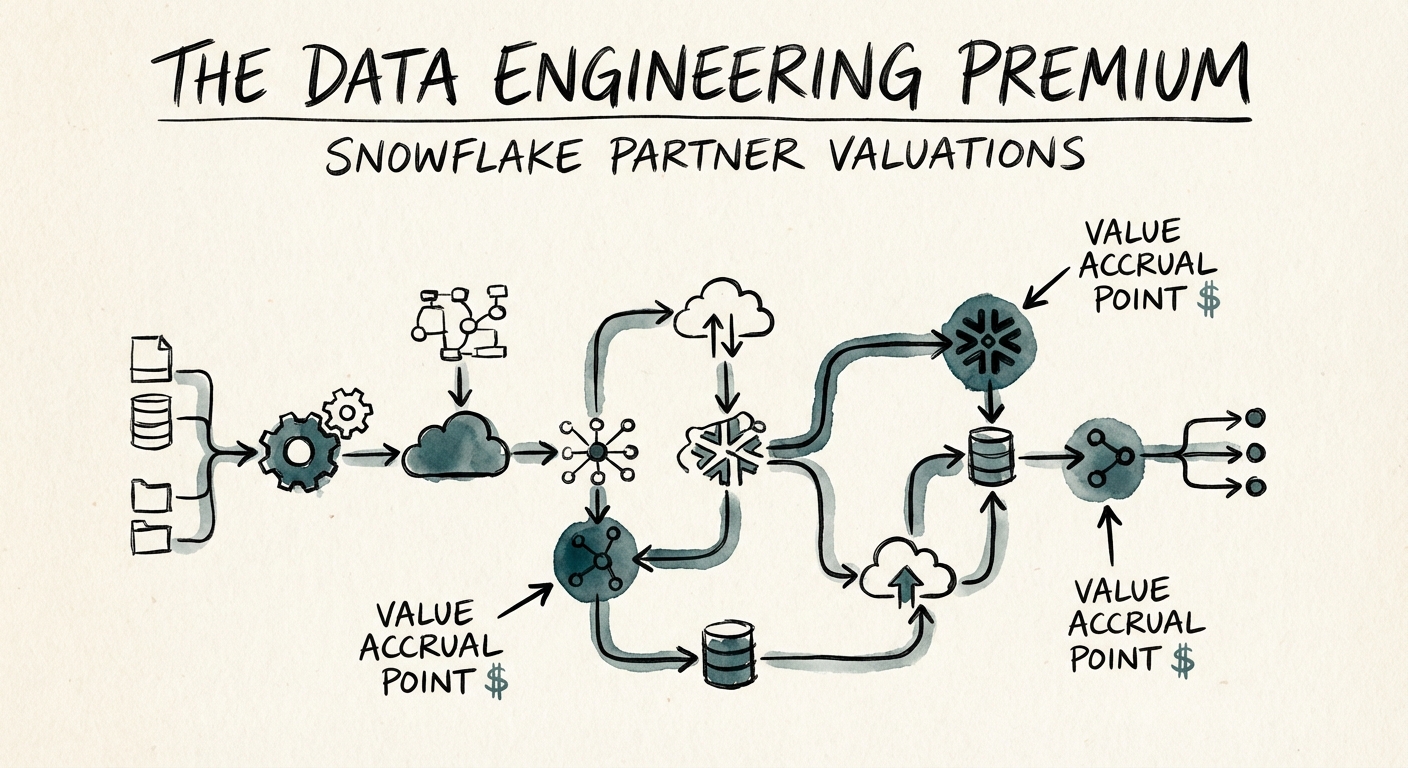
BRIEF · EXIT READINESS
The Data Engineering Premium: Why 'Pipe Builders' Trade at 14x While 'Dashboard Builders' Stall at 8x
Why specialized data engineering firms command 14x EBITDA multiples while generalist analytics shops stall at 8x. A valuation diagnostic for PE investors.
14x EBITDA Multiple for Specialized Data Engineering Firms
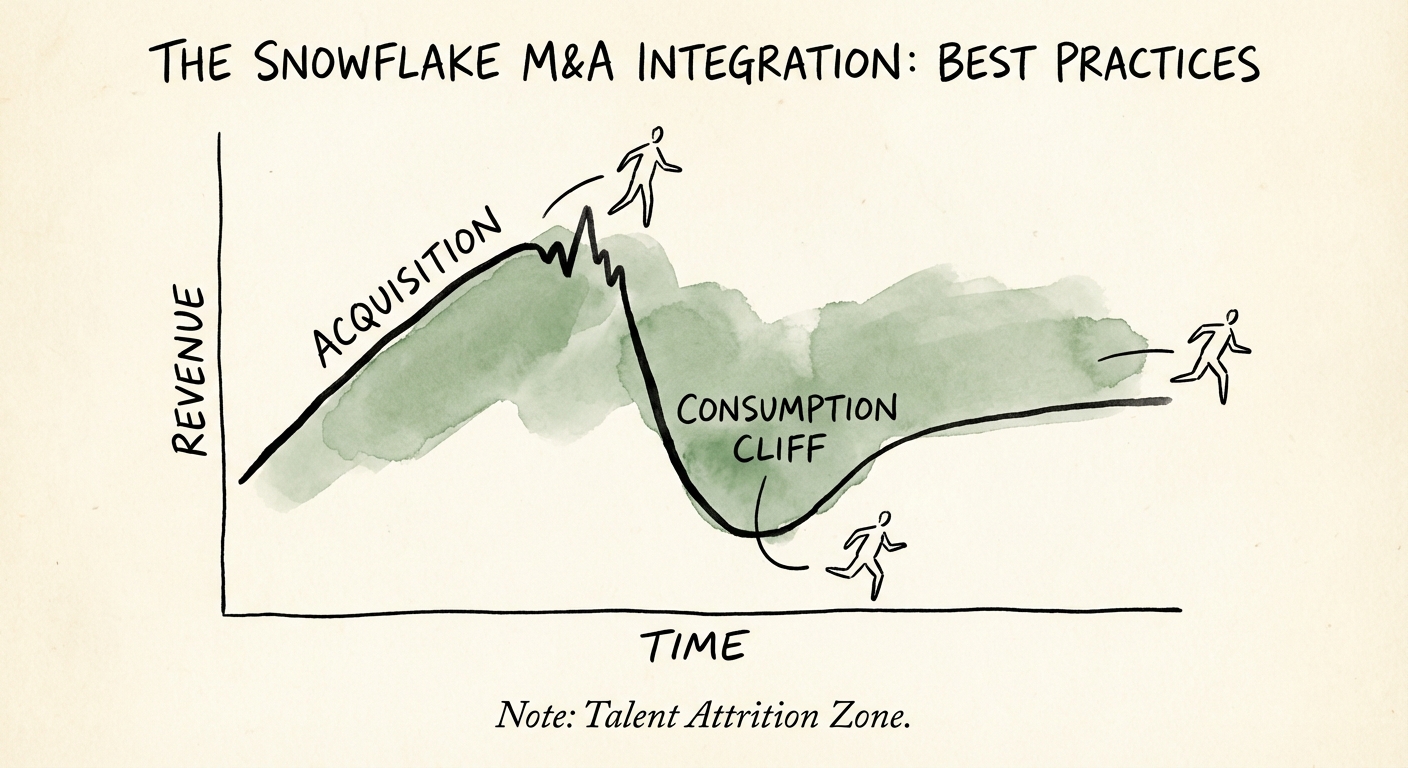
BRIEF · MIGRATION & INTEGRATION
The 'Consumption Cliff': Why Snowflake Partner Integrations Fail (And How to Fix Them)
Prevent value destruction in Snowflake partner acquisitions. A post-merger playbook for PE sponsors to navigate the 'Consumption Cliff' and retain elite data talent.
40% Avg. Talent Churn Post-Close
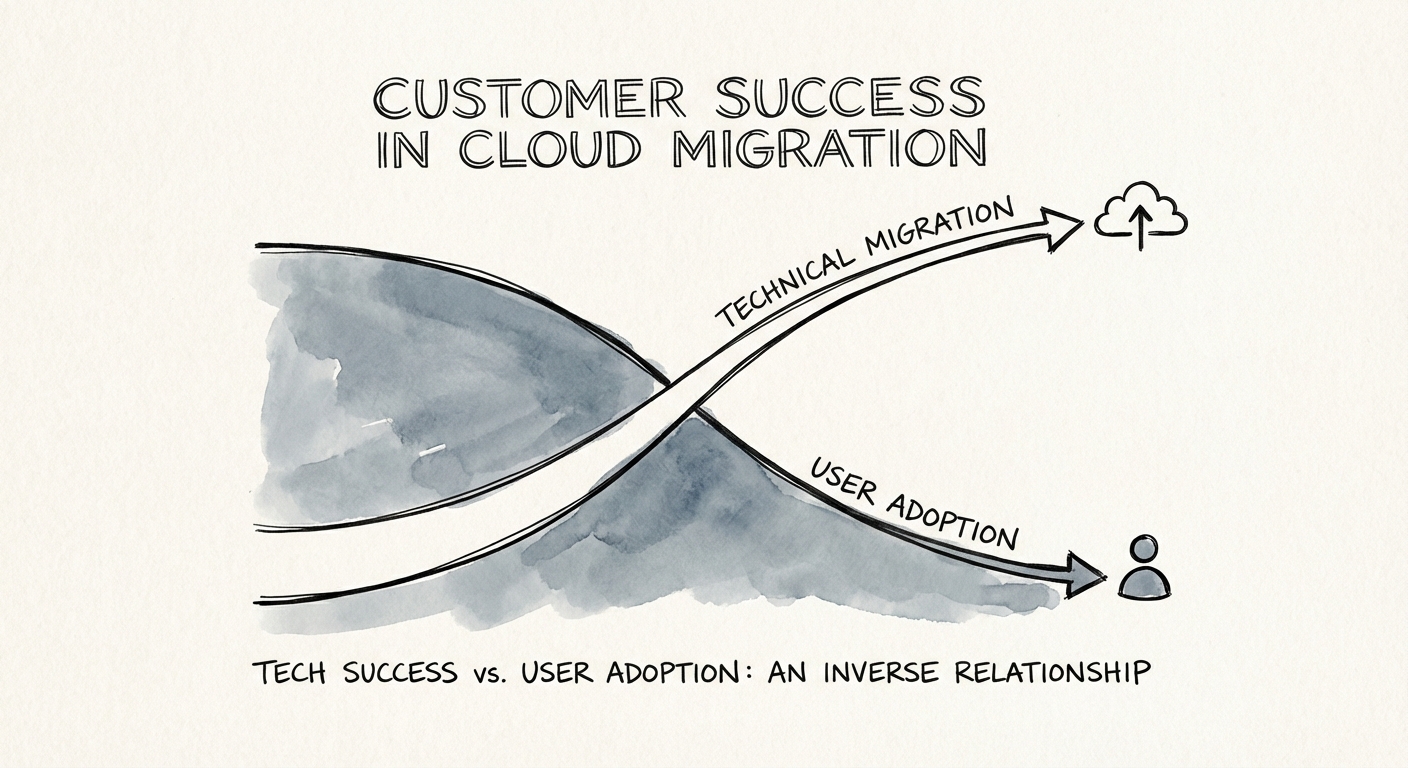
BRIEF · PROCESS DOCUMENTATION
The 'User Revolt' Diagnostic: Why 62% of Atlassian Cloud Migrations Fail on Adoption
Why 62% of Atlassian Cloud migrations fail on adoption, not data. A diagnostic guide for preventing the 'User Revolt' and ensuring business continuity.
62% Migration Failure Rate
BRIEF · MIGRATION & INTEGRATION
Atlassian Partner M&A Integration: The Playbook for Preserving the 'Platinum' Premium
Post-merger integration best practices for Atlassian Solution Partners. Benchmarks for talent retention, badge preservation, and realizing synergies in 2026.
47% Year 1 Talent Churn Risk
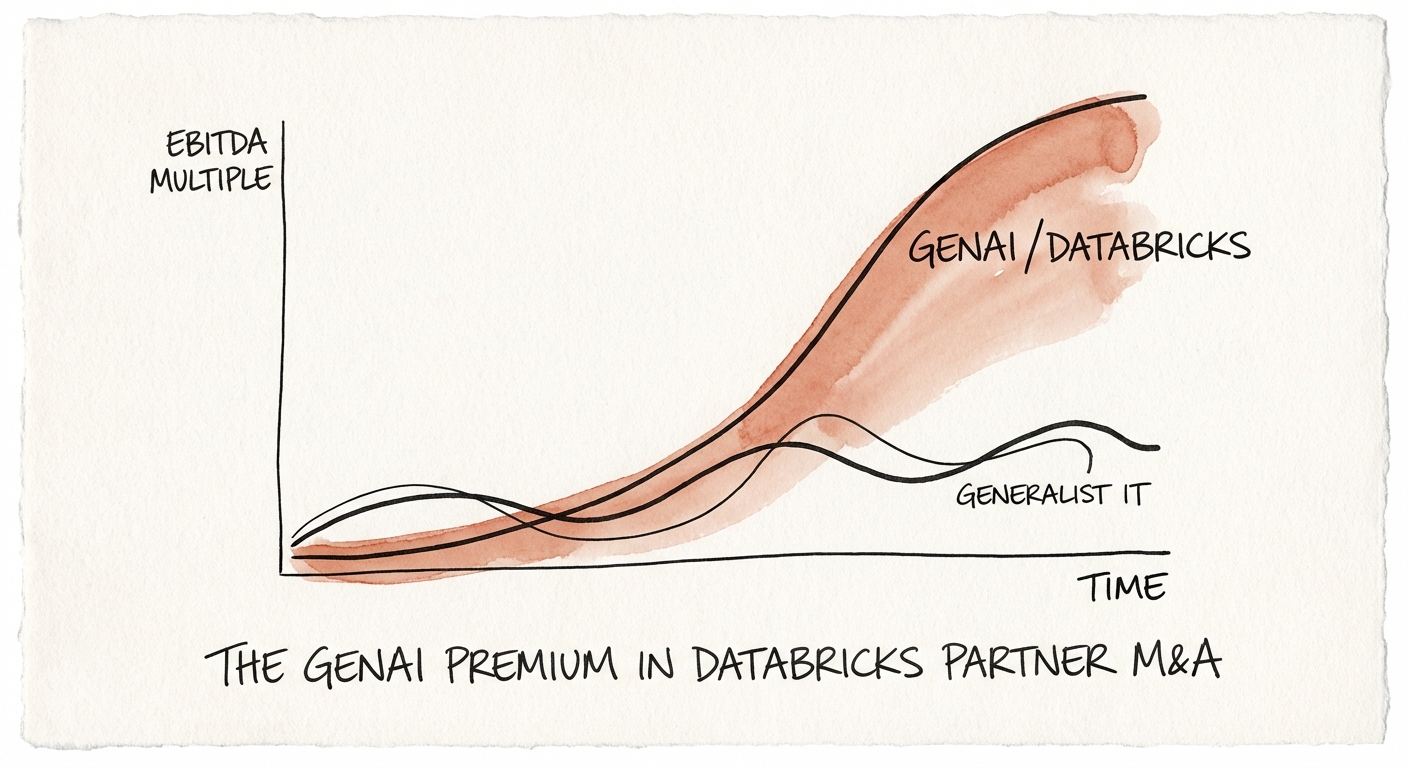
BRIEF · EXIT READINESS
The GenAI Premium: Why Databricks Partners with LLM Capabilities Trade at 14x
Data & AI consultancies are bifurcating. Generalist Databricks partners trade at 8x EBITDA, while GenAI specialists command 14x. Here is the diagnostic.
14x EBITDA Valuation
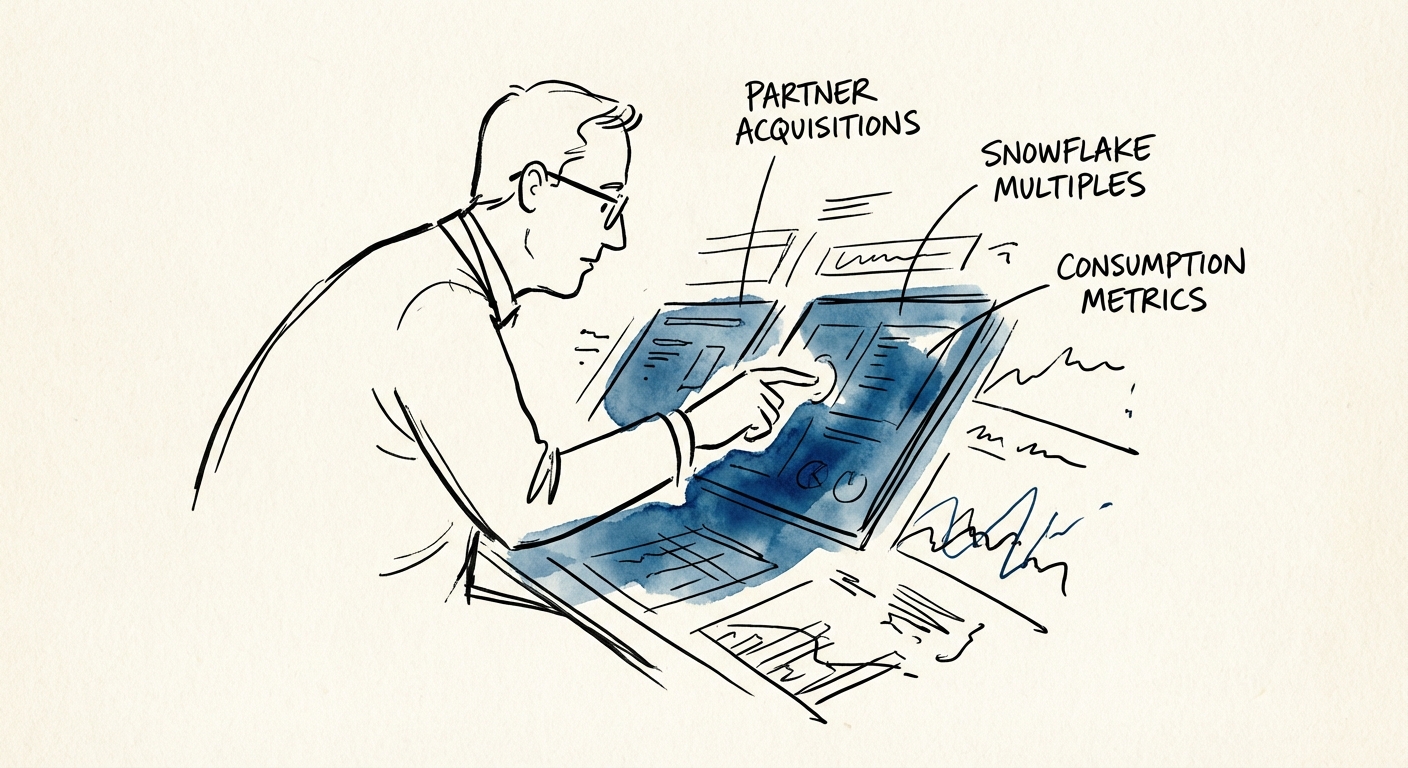
BRIEF · EXIT READINESS
The Data Cloud Arbitrage: How PE Firms Evaluate Snowflake Partner Acquisitions
A diagnostic guide for PE firms evaluating Snowflake partner acquisitions. Analysis of consumption metrics, Native App valuation premiums, and the 2026 due diligence framework.
120% Net Revenue Retention (NRR) Benchmark for 'Platform' Partners
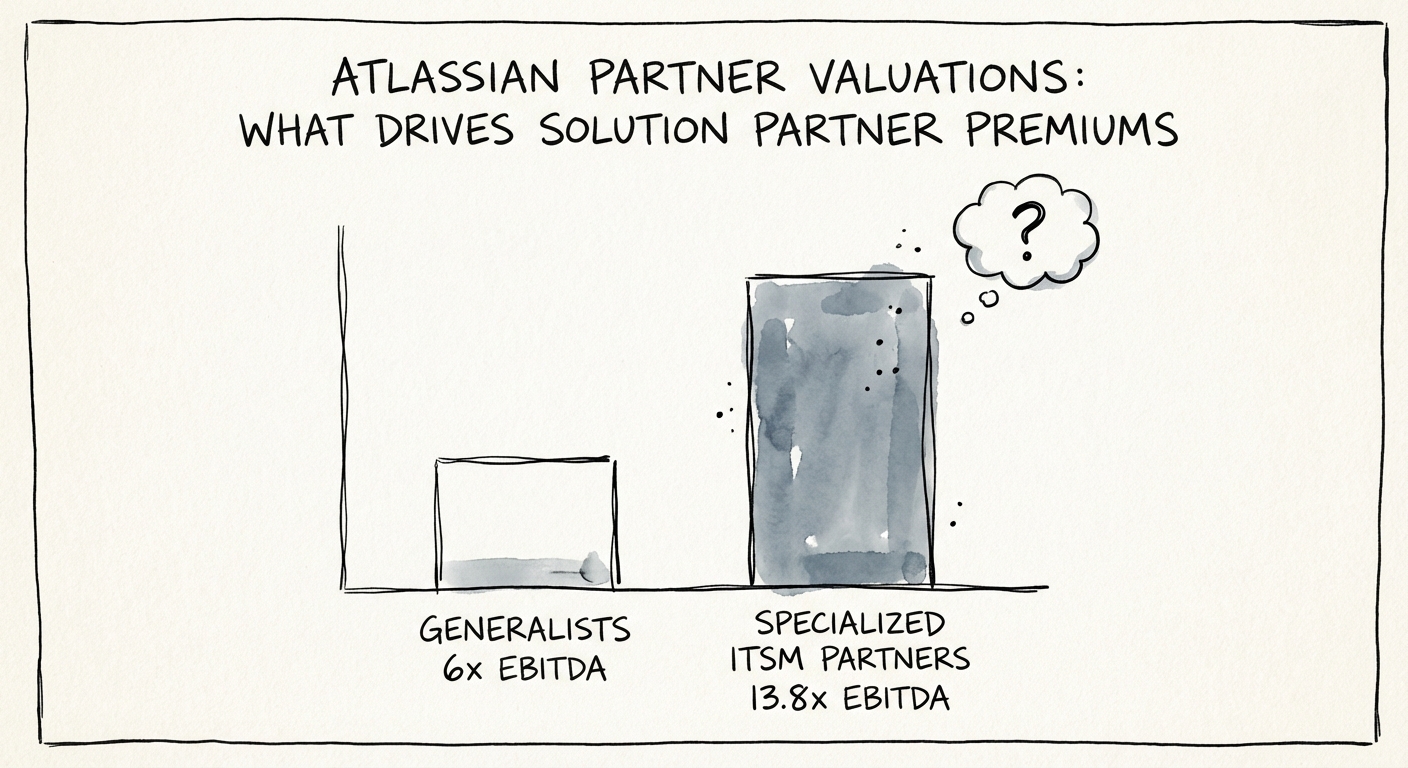
BRIEF · EXIT READINESS
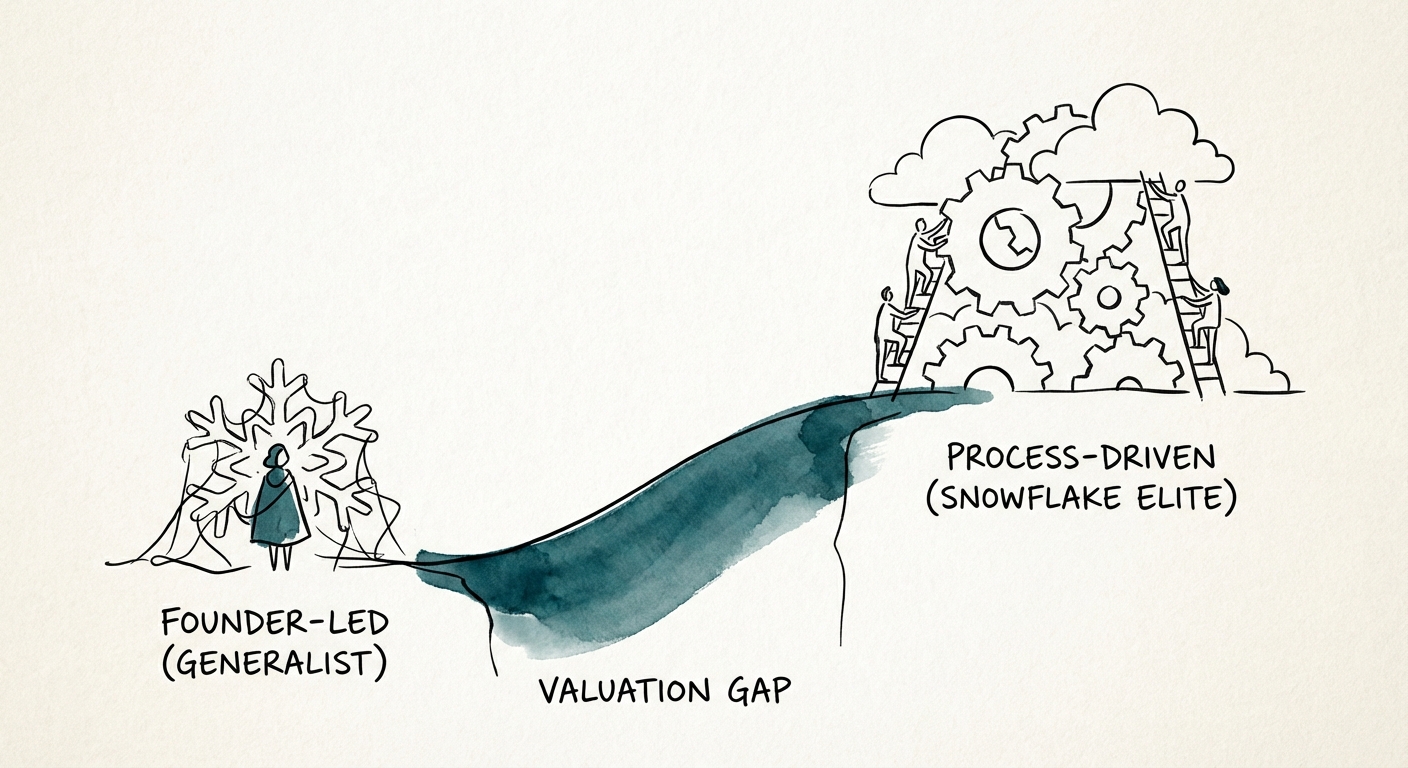
Atlassian Partner Valuations: The Gap Between "Jira Shops" and Enterprise Strategy
Data-driven analysis of Atlassian Partner valuations in 2026. Why Agile at Scale and ITSM specialists trade at 13.8x EBITDA while generalists stall at 6x.
13.8x EBITDA Multiple (Specialized)
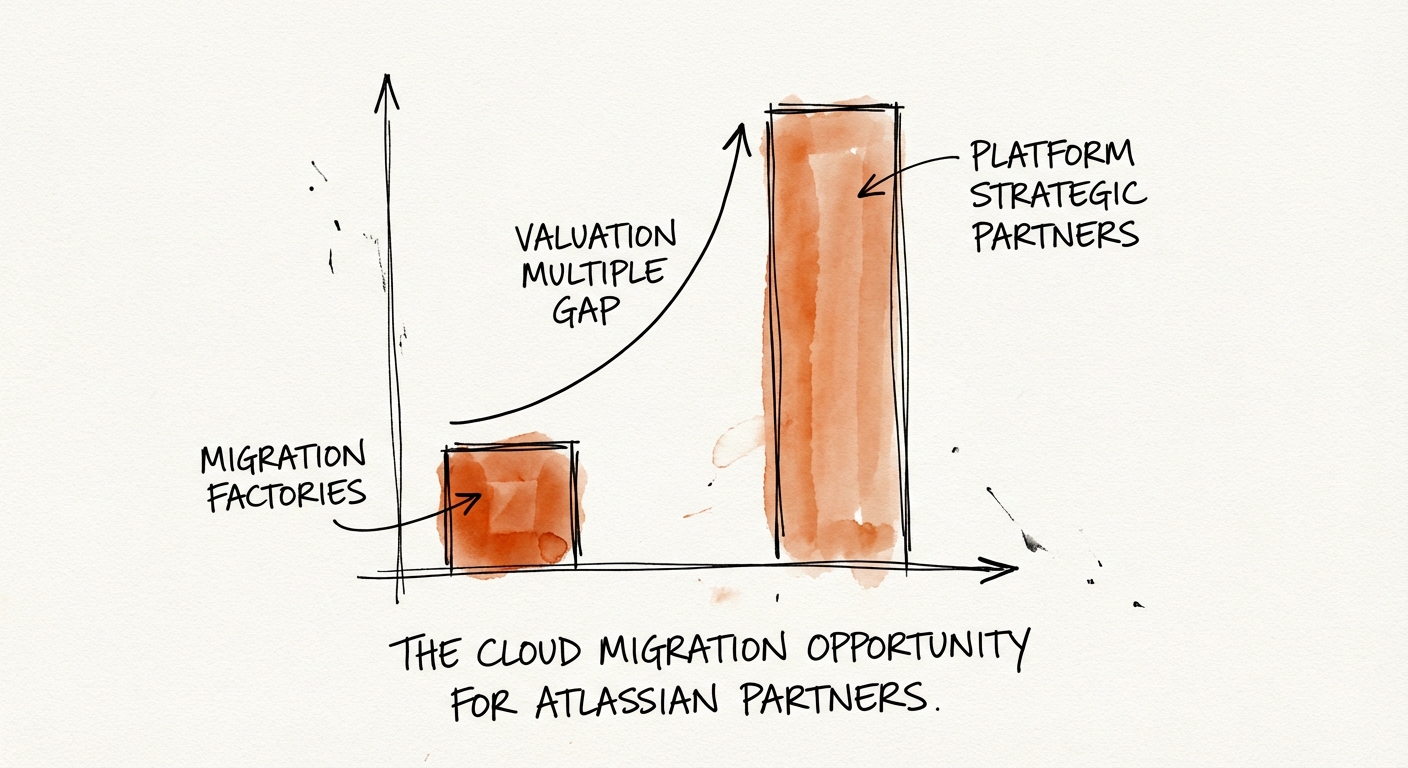
BRIEF · REVENUE ARCHITECTURE
The Atlassian Partner 'Migration Cliff': Why 'Lift and Shift' Revenue is Worth 4x Less in 2026
Server migrations are over. The new opportunity for Atlassian Partners is Data Center transformation and Cloud consolidation. Here is the 2026 playbook.
4x Valuation Gap (Strategic vs. Migration)
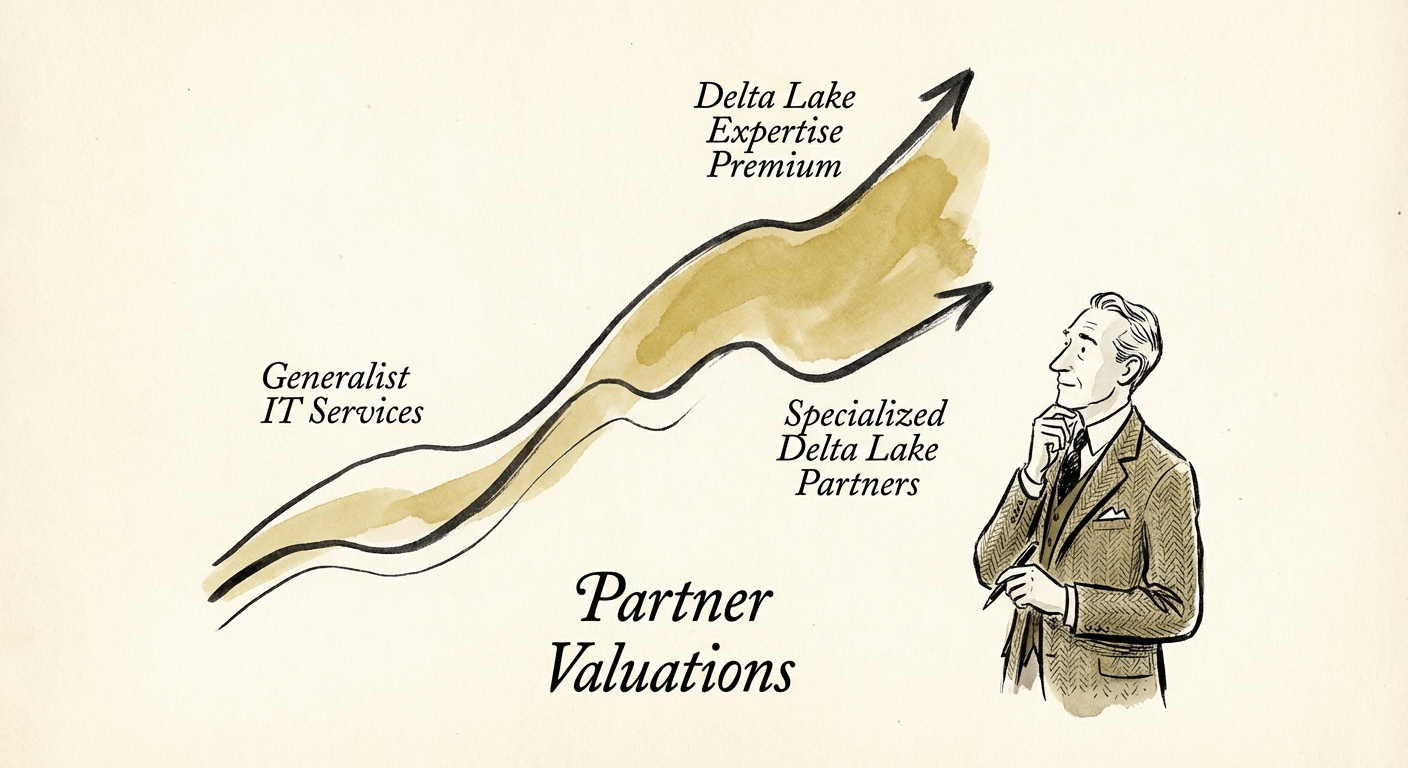
BRIEF · EXIT READINESS
The Delta Lake Expertise Premium: Why 'Lakehouse' Shops Trade at 14x While Generalists Stall at 8x
Why Databricks and Delta Lake partners trade at 14x EBITDA while generalist data firms stall at 8x. M&A benchmarks and exit strategy for data consultancies.
Premium Projected EBITDA Multiple for Lakehouse-Native Firms
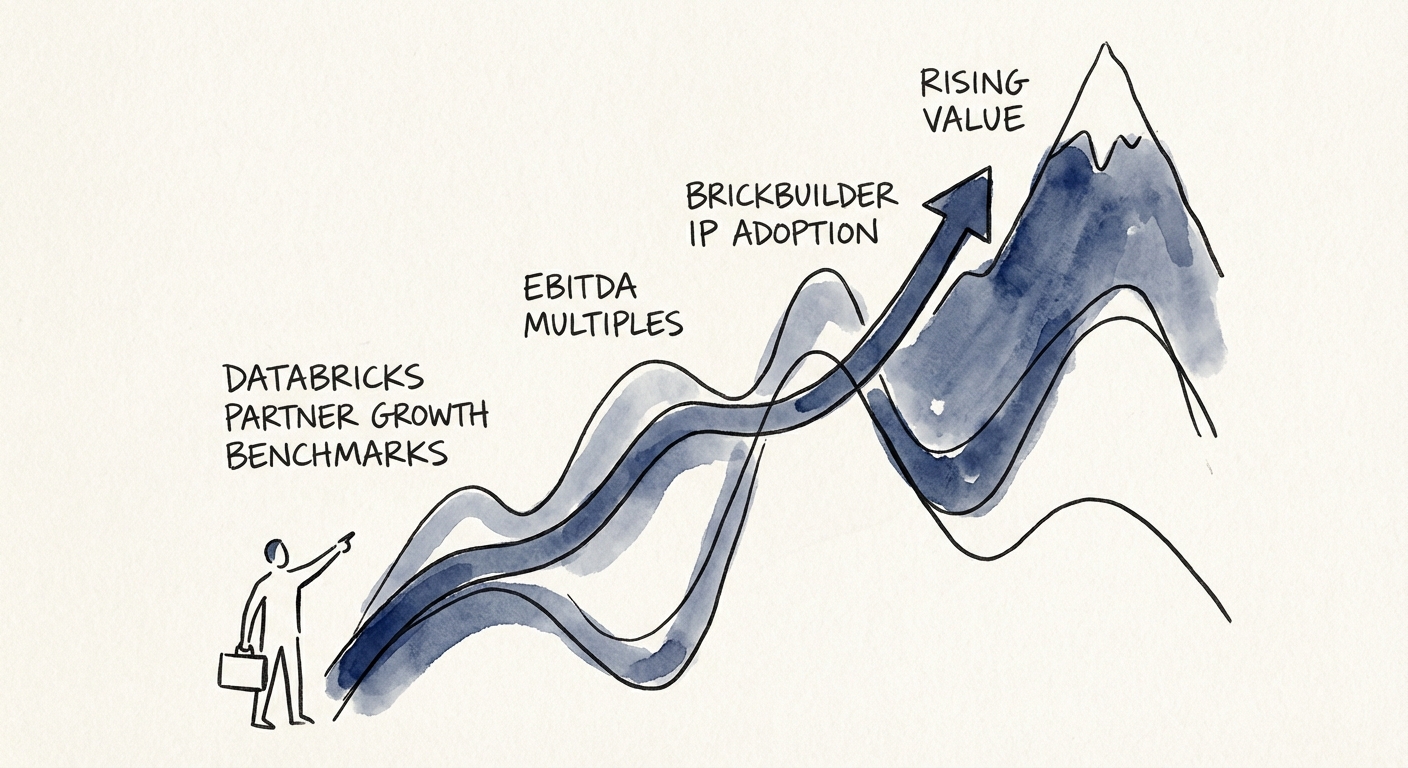
BRIEF · EXIT READINESS
Databricks Partner Valuations: Why 'Brickbuilder' Status Is Just the Baseline
New data on Databricks partner valuations. Why 'Brickbuilder' specialists command 14x EBITDA while generalist SIs stall at 6x. 2026 growth benchmarks.
13.6x Top-Tier EBITDA Multiple
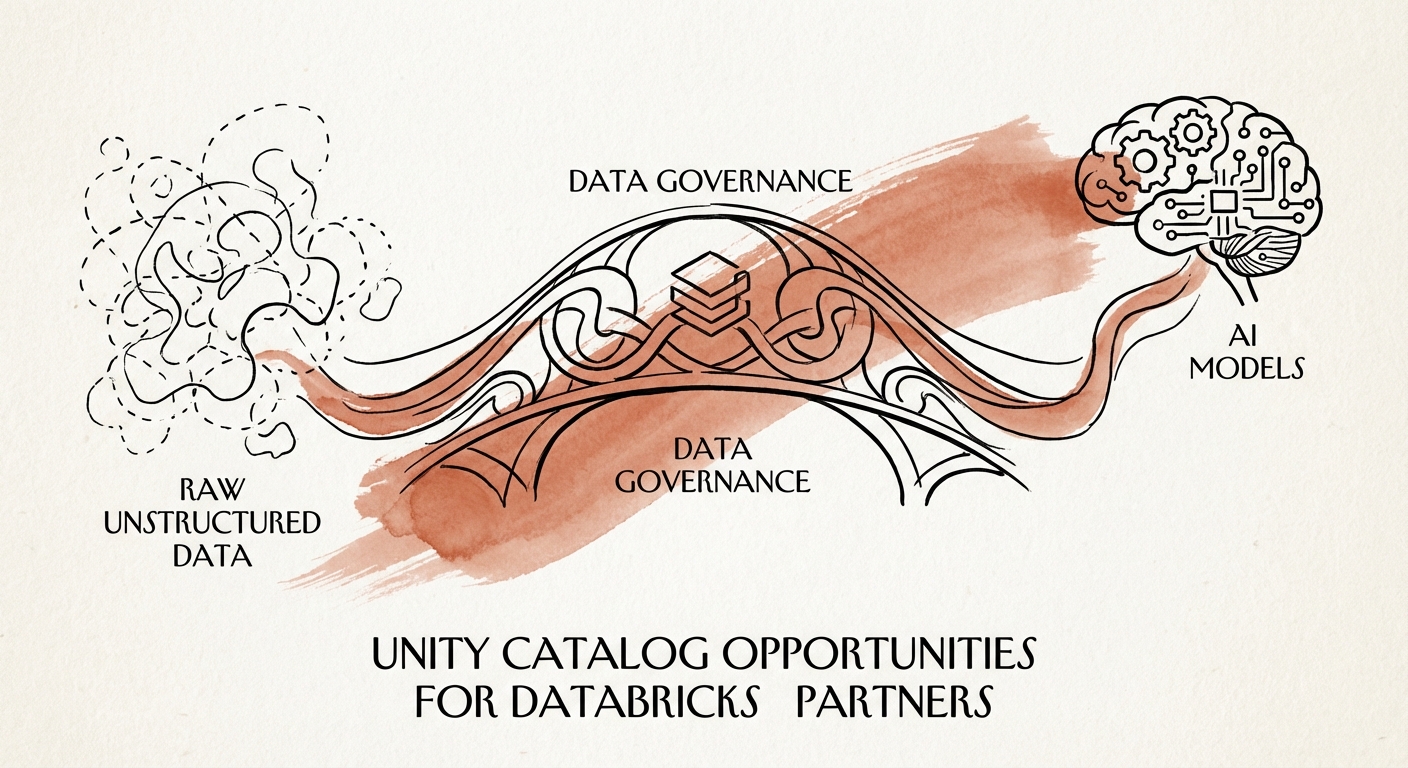
BRIEF · GTM EXECUTION
The Unity Catalog Premium: Why Governance Specialists Trade at 14x (And Generalists Stall at 6x)
Why Databricks partners specializing in Unity Catalog migration and governance command 14x multiples. A diagnostic for shifting from ETL body shops to AI strategy firms.
14x EBITDA Multiple for AI-Gov Partners